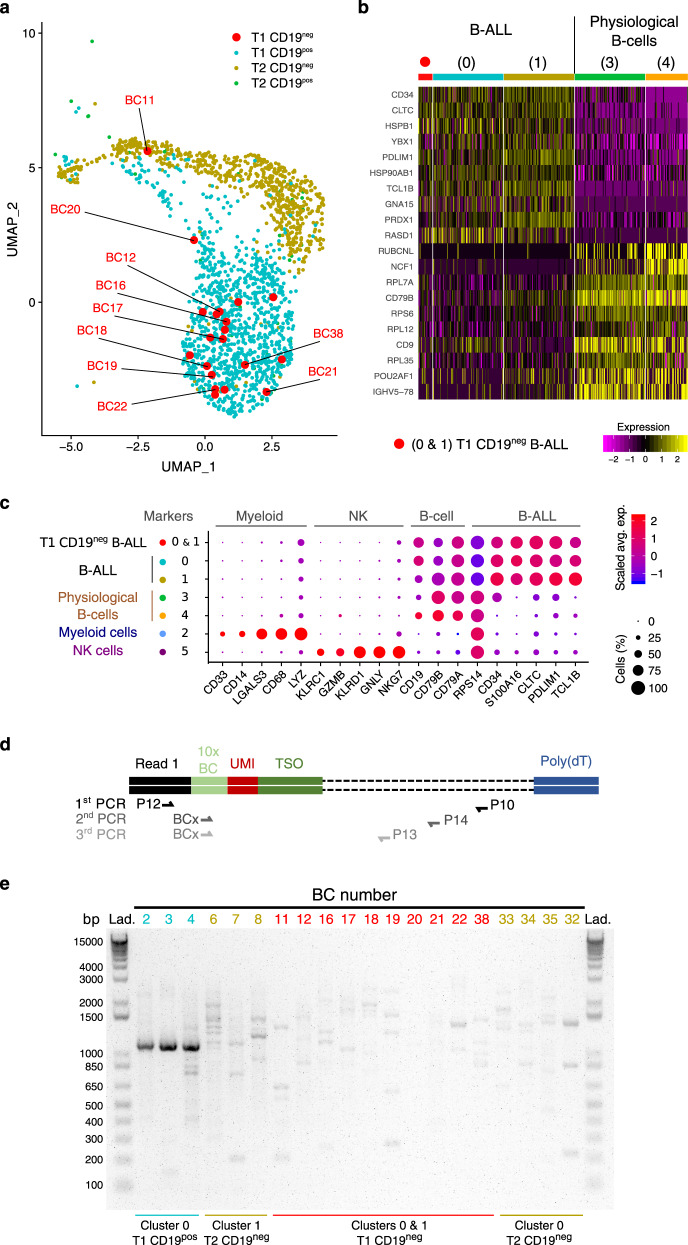
Fig. 2. Detection of CD19neg B-ALL clones before CAR-T treatment.
a UMAP plot focused on tumoral cells (clusters 0 and 1) and colored according to sample of origin. The 20 cells from T1-CD19neg samples are highlighted by larger red dots. Sequences of 10× cell barcode (BC) of interest are indicated in Supplementary Table 1. b Heatmap showing normalized and scaled expression level of 20 genes differentially expressed between tumoral clusters (0 and 1), and either immature B cells (cluster 3) or mature B cells (cluster 4). Gene expression profiles of the 20 T1-CD19neg cells are shown independently to the other B-ALL cells. Clusters 0, 1, and 3 were down-sampled to 100 cells for a better readability. Number of expressed genes detected in the various clusters are shown in Supplementary Fig. 10. c Dot plot of marker genes expression, same as Fig. 1b except that T1-CD19neg cells from clusters 0 and 1 were analyzed independently, and that some differentially expressed genes between tumoral versus physiological cells were added. d Nested-PCR strategy to detect CD19 transcript in single cell. e Agarose gel of CD19 cDNA amplified by nested-PCR. Lanes are labeled according to the cell BC number for which the sample of origin is indicated at the bottom of the gel. Data are representative of independent backtracking experiments that were performed twice for cells with BC number 32, 33, 34, and 35; and three times for all other cells. Localizations on the UMAP plot of backtracked T2-CD19neg cells are shown in Supplementary Fig. 11.

