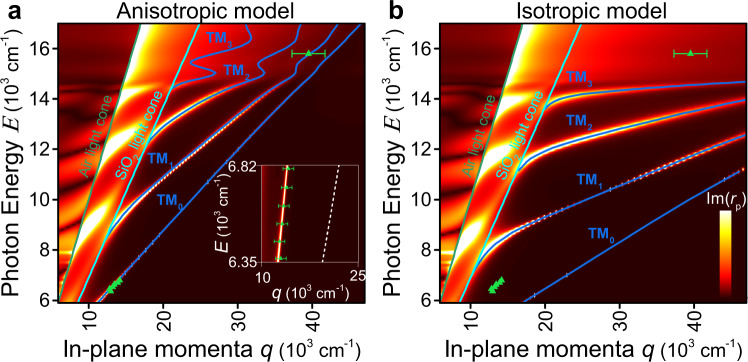
Fig. 4. Dispersion of a planar MoS2 waveguide.
a, b Transfer matrix calculations49 for the MoS2/SiO2/Si system for MoS2 anisotropic and isotropic (in the assumption of optical constants for the c-axis equal to those for the ab-plane) models. The experimental (q = 1/λ, E = h∙c/λ) data points (green triangles) show good agreement with the calculated dispersion (blue lines) based on the anisotropic dielectric function from Fig. 2a. The inset is a magnified near-infrared spectral range with a white dashed line illustrating the isotropic case’s dispersion relation. The error bars show the uncertainty in the determination of mode in-plane momenta q from near-field images displayed in Fig. 3.

