
Figure 2.
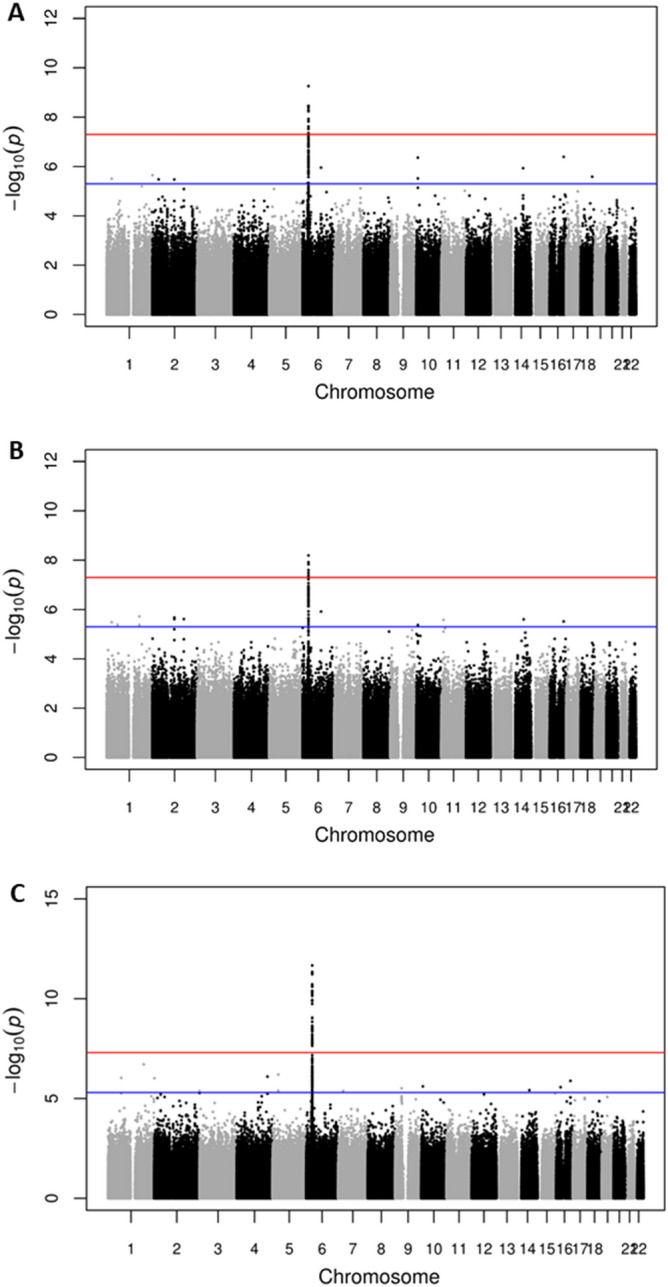
Manhattan plots showing genome-wide association with podoconiosis in Ethiopia. (A) dataset 1 comprising combined new samples from the Amhara, Oromo and Wolaita ethnic groups; (N = 1892, 943 cases and 949 controls); (B) dataset 2 from the Amhara and Oromo ethnic groups (N = 1511, 752 cases and 759 controls) and (C) dataset 3 comprising all available samples i.e. dataset 1 plus the samples from the previously-published podoconiosis GWAS undertaken in the Wolaita group (N = 2289,1137 cases and 1152 controls). For each plot, the x-axis indicates chromosomal position and the y-axis indicates the − log10 P value. Points between the blue and red lines shows suggestive association (P < 5.0 × 10⁻⁷) whereas points above the redline shows genome-wide significance (P < 5.0 × 10⁻⁸) results. The R programme was used to generate the plots48.