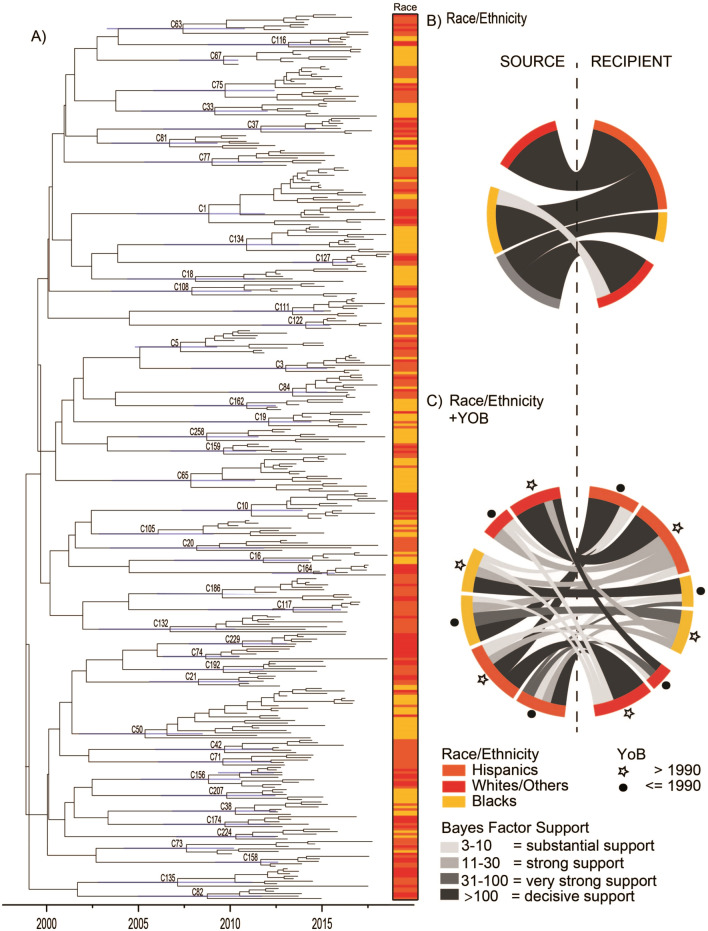
Figure 3.
(A) BEAST phylogeny of all clusters; (B) chord diagram for viral transmission between racial/ethnic groups (Hispanics, Blacks, Whites/Others); (C) chord diagram for viral transmission between racial/ethnic groups plus age group (born in or before 1990, born after 1990). (A) Shows a maximum clade credibility phylogenetic tree with all clusters that contain five or more cluster members. Tips are labeled with the race/ethnicity associated with the taxa at that tip. In (B) and (C), chord thickness indicates the magnitude of the transition rate, and color indicates Bayes Factor support. Only supported transition rates from discrete trait analysis are displayed. YoB Year of Birth.

