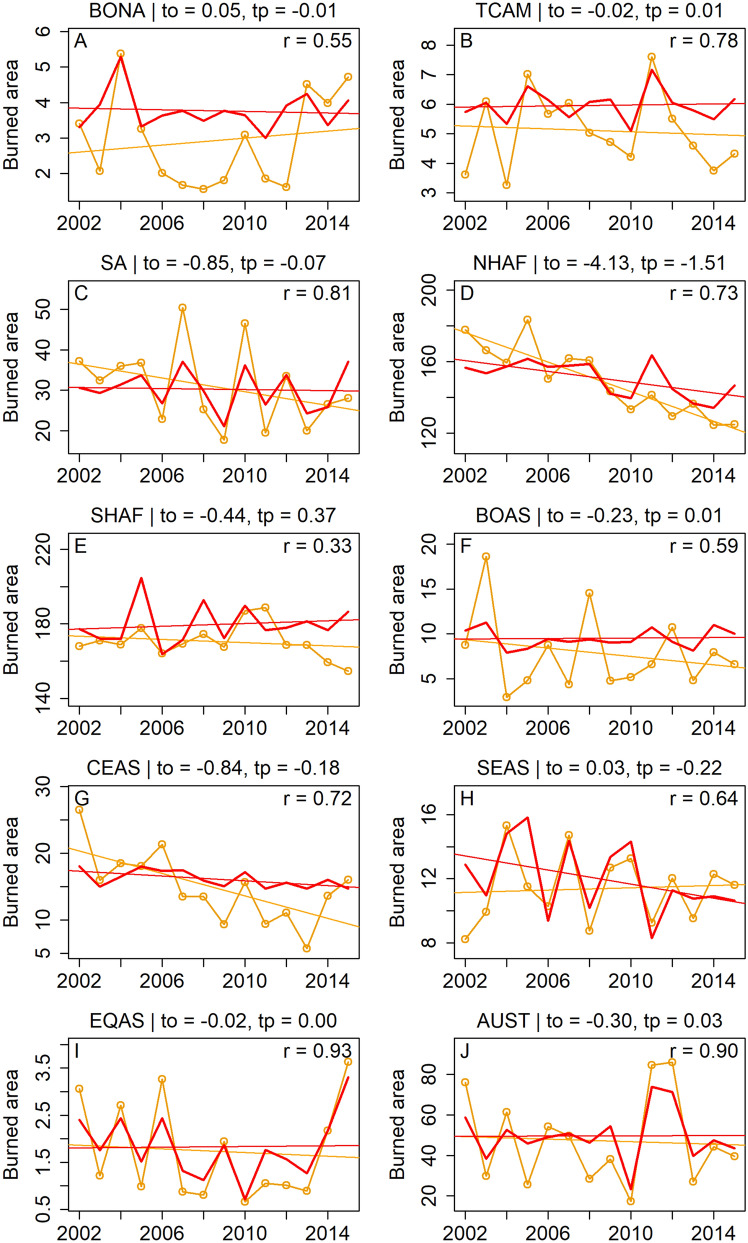
Figure 3.
Predicted and observed interannual burned area. Total annual burned area observed in different geographic regions (orange lines and circles) along with that predicted by the minimal model for each region (solid red line). Regression lines indicate the long-term trend in burned area, with the trends in observed () and predicted () burned areas mentioned above each panel. Interannual variability in burned area is well captured in our model, especially in Equatorial Asia, Australia, Southeast Asia, and South America. Long-term decline is highest in northern Africa, with our model predicting 36% of the observed decline. Fires in southern Africa drop sharply after 2013.

