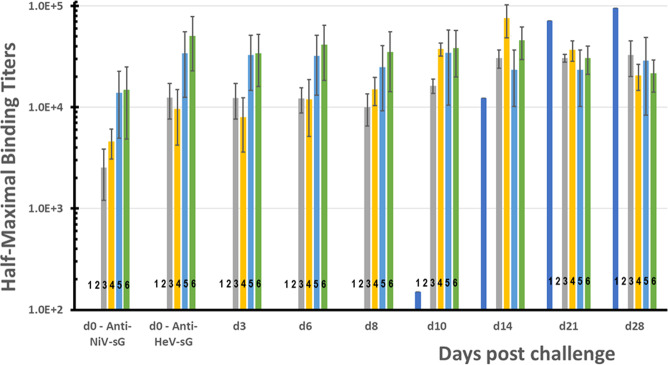
Fig. 2. Post-challenge anti-HeV-sG antibody binding titers clustered by the day of sera sampling.
The first cluster from the left shows titers for binding to NiV-sG antigen on the day of the challenge, d0. All other clusters show titers for binding to vaccine subunit HeV-sG antigen at the day of the challenge, d0, and at days 3, 6, 8, 10, 14, 21, and 28 post challenge. The bars in each cluster, numbered from 1 to 6, show the average titer and the standard deviation for sera samples from Study 1 AGM groups: bars 1—control group in HeV challenge (these bars show the titers for the single survived AGM-1-C1-2); bars 2—control group in NiV challenge; bars 3—single-dose group in HeV challenge; bars 4—single-dose group in NiV challenge; bars 5—prime/boost group in HeV challenge; and bars 6—prime/boost group in NiV challenge. Error bars show standard deviations.

