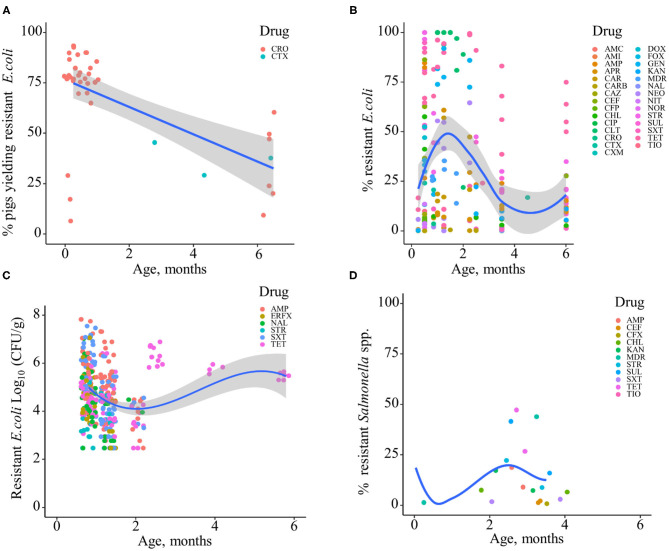
Figure 5.
Age-dependent antimicrobial resistance dynamics in production pigs. (A) Percentage of pigs yielding antimicrobial-resistant fecal E. coli by age (data from n = 2 studies). (B) Percentage of antimicrobial-resistant fecal E. coli by age (data from n = 13 studies). (C) Abundance of antimicrobial-resistant fecal E. coli (CFU/g) (data from n = 2 studies). Plotted individual observations represent antimicrobial resistance to individual drugs (AMC, amoxicillin–clavulanic acid; AMI, amikacin; AMP, ampicillin; APR, apramycin; CAR, carbadox; CARB, carbapenem; CAZ, ceftazidime; CEF, cephalothin; CFP, cefoperazone; CHL, chloramphenicol; CIP, ciprofloxacin; CLT, chlortetracycline; CRO, ceftriaxone; CTX, cefotaxime; CXM, cefuroxime; DOX, doxycycline; ERFX, enrofloxacin; FOX, cefoxitin; GEN, gentamicin; KAN, kanamycin; NAL, nalidixic acid; NEO, neomycin; NIT, nitrofurantoin; NOR, norfloxacin; STR, streptomycin; SUL, sulfamethoxazole; SXT, trimethoprim–sulfonamides; TET, tetracycline; TIO, ceftiofur). MDR—multidrug resistance (to ≥3 drug classes). The blue trend lines with the confidence bands (the gray area around the blue line) are shown in (A–C); these in each case were estimated using locally weighted scatterplot smoothing (LOESS). (D) Percentage of antimicrobial-resistant fecal Salmonella spp. (data from n = 4 studies).

