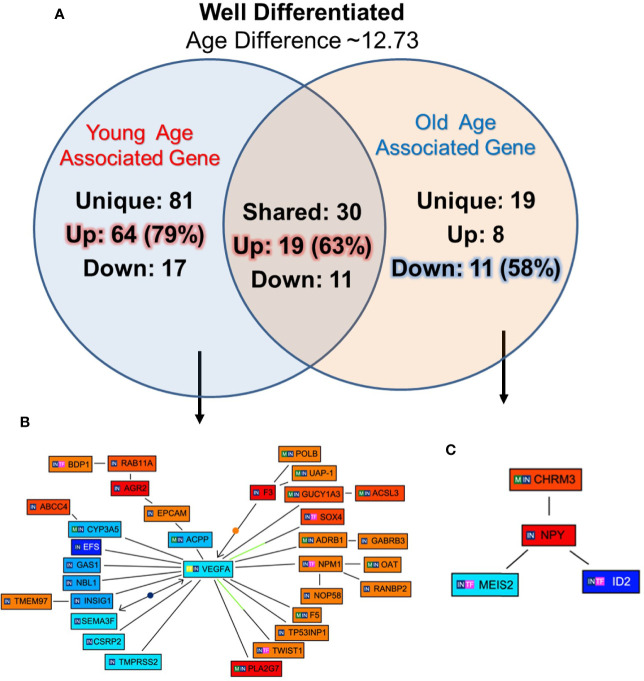
Figure 4.
Functional analysis of differentially expressed genes in well differentiated tumors of young and old prostate cancer patients by GePS system. (A) The total 81 genes were uniquely associated with young age [64 (79%) genes up-regulated and 17 (21%) genes down-regulated] and 19 genes with old age [8 (42%) up-regulated and 11 (58%) down-regulated]. There are 30 genes [19 (63%) up-regulated and 11 (37%) down-regulated were common between the both the groups. (B, C) The Venn diagram analysis represents significant genes with at least 3-fold expression. The hierarchical cluster showing the expression levels of the 32 significant genes associated with WD-young group (B) and 04 genes with WD-old group (C). The unique genes associated with WD young and old group were imported into GePS. Orange/red color shows up-regulation and blue color shows down-regulation. The intensity of blue and red colors indicates the degree of up or down-regulation, respectively. A solid line represents an expert curated association between the two gene products and a dotted line means there is an association by co-citation. Expert level filter settings were used to generate the network, which contains interactions curated by experts (Genomatix and NetPro) based on literature and genes without any interactions were filtered out.

