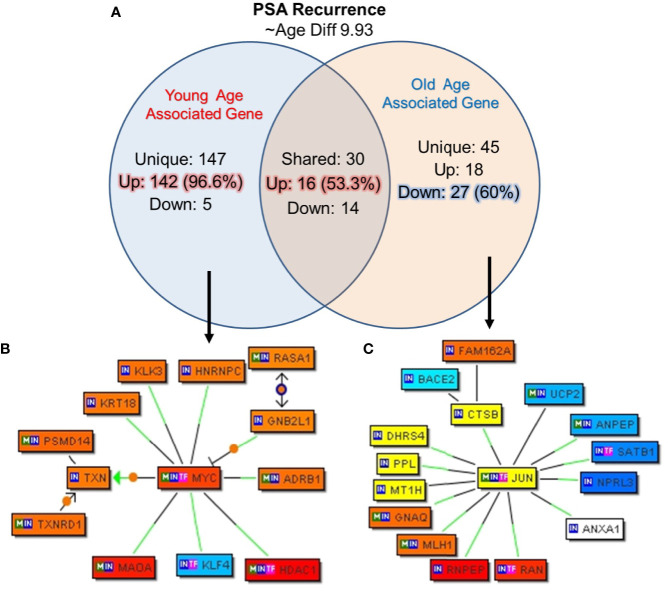
Figure 7.
Uniquely expressed genes in PSA recurrence group of young and old prostate cancer patients. (A) 147 genes were uniquely associated and 96.6% (142) genes were up-regulated in rPSA-young prostate cancer group. In old group 45 genes were uniquely expressed and 60% (27) genes were down regulated. Thirty genes were found to be co-expressed in both the groups. ~53% (N=16) were up-regulated and ~47% (N=14) genes were down-regulated. rPSA and marked age-associated differences in gene expression signatures were identified in prostate tumors (B) MYC form a central node with HDAC1, RASA1, and KLK3/PSA genes and were down-regulated in young-rPSA patients, and (C) JUN form a central node with ANAX1, NPRL3, SATB1, UCP2, DHRS4, CTSB, PPL, BACE2, and MLH1 in old-rPSA patients. The Venn diagram analysis represents significant genes with at least 3-fold expression. The hierarchical cluster showing the expression levels of the significant genes. Orange/red color shows up-regulation and blue color shows down-regulation. The intensity of green and red colors indicates the degree of up or down-regulation, respectively. A solid line represents an expert curated association between the two gene products and a dotted line means there is an association by co-citation. Expert level filter settings were used to generate the network, which contains interactions curated by experts (Genomatix and NetPro) based on literature and genes without any interactions were filtered out.

