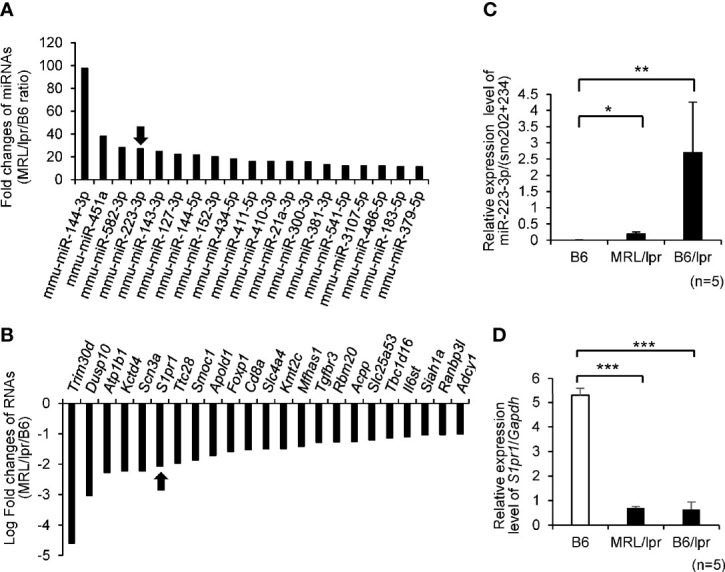
Figure 1.

Top 20 differential expression levels of miRNAs and mRNAs in CD4+T cells isolated from MRL/lpr lupus-prone (MRL/lpr) vs C57BL/6 (B6) mice by microarray analysis. (A) Fold change (ratio between MRL/lpr/B6) in miRNA expression MRL/lpr vs B6. We focused on mmu-miR-223-3p which was indicated by arrow. (B) Candidate target genes for upregulated mmu-miR-223-3p were identified using the commonly used prediction algorithm, miRDB. These targets and our mRNA expression profiles were integrated. Fold change (ratio between MRL/lpr/B6) in mRNA expression MRL/lpr vs B6. We focused on S1pr1 which was indicated by arrow. (C) The expression level of miR-223-3p was evaluated by TaqMan quantitative PCR in MRL/lpr mice and B6/lpr lupus-prone (B6/lpr) mice compared with B6 mice (n = 5 per group, 16-week-old female). (D) The expression of S1pr1 in CD4+T cells of mice spleen was evaluated by TaqMan quantitative PCR (n =5 per group, 16-week-old female). Data are presented as mean ± SEM. *p < 0.05, **p < 0.01, ***p < 0.001, by Student’s t-test.
