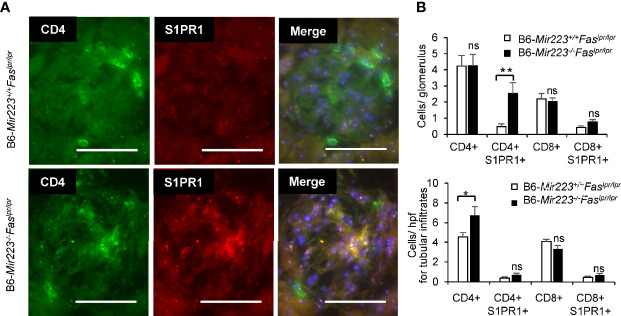
Figure 6.
Glomerulonephritis with infiltration of CD4+S1PR1+ T cells in in B6-Mir223−/−Faslpr/lpr (A) The image of CD4+ cells, CD4+S1PR1+ cells, CD8+ cells and CD8+S1PR1+ cells in glomerular lesion in B6-Mir223−/−Faslpr/lpr compared to B6-Mir223+/+Faslpr/lpr mice (n = 5 per group). Images are representative of five mice per group. Bars = 50 µm. (B) The number of CD4+ cells, CD4+S1PR1+ cells, CD8+ cells and CD8+S1PR1+ cells in glomerulus or tubular lesion in B6-Mir223−/−Faslpr/lpr compared to B6-Mir223+/+Faslpr/lpr mice (n = 5 per group). Data are presented as mean ± SEM. *p < 0.05, **p < 0.01, ns, not significant, by Student’s t-test in (B).

