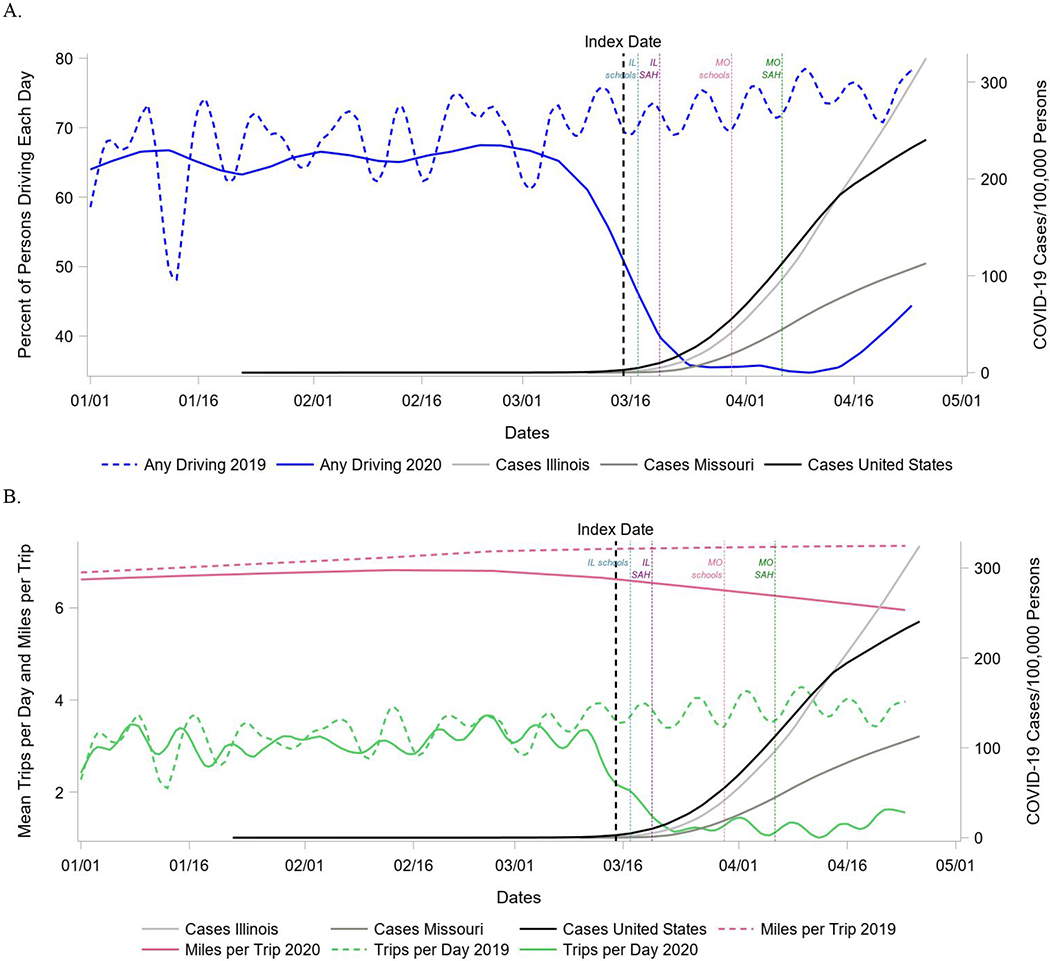
Figure 1.

Driving behavior before and after the onset of the pandemic during 2020, and compared to driving during the same time periods in the year prior to the pandemic.
(A) Percent of persons driving each day and (B) mean number of trips per day and miles per trip presented with number of confirmed COVID-19 cases for the entire US, Missouri, and Illinois (second Y axis). Reference lines indicate when school closure and stay-at-home orders went into effect in state, which may have impacted trips made and/or number of other drivers on the road. Abbreviations: IL=Illinois; MO=Missouri; SAH=Stay at Home.
