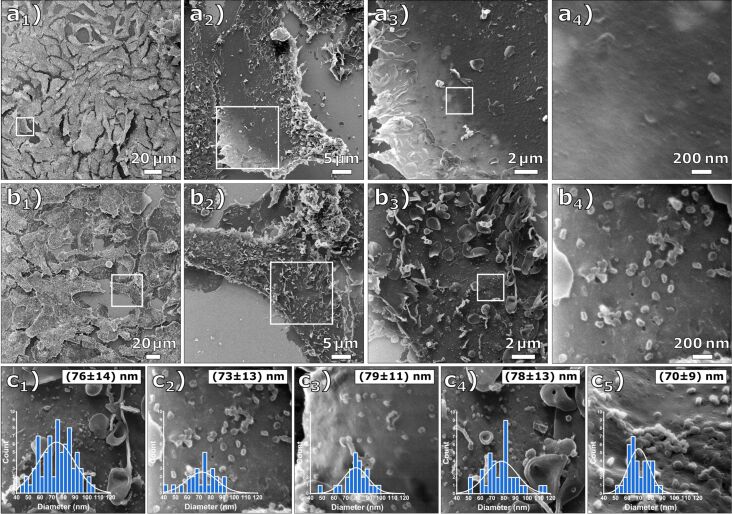
Figure 1.
Comparative HIM images of Vero E6 cells that were mock-infected and infected at MOI 1. (a1–4) Mock-infected cells at different magnifications (FOV 200 µm, 45 µm, 15 µm, and 1.7 µm) and (b1–4) cells infected at MOI 1 at different magnifications (FOV 250 µm, 45 µm, 15 µm, and 1.7 µm). The cell membrane is covered with the virus particles. (c1–5) Determined virus particle diameter distributions. The inserted histograms show the respective image evaluation with normal distribution, mean value, and standard deviation. The average diameter of all evaluated images is 75 ± 13 nm.

