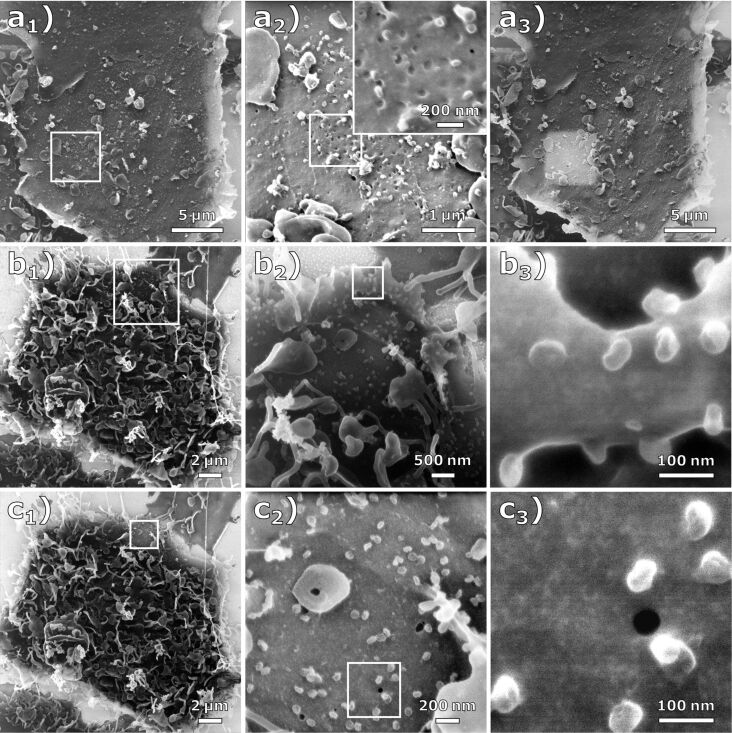
Figure 2.
Effect of carbon deposition during HIM imaging. (a1) HIM image (FOV 20 µm) of a cell infected at MOI 1 with charge compensation. (a2) HIM images at high magnification (FOV 4.5 µm and 1 µm) with charge compensation. (a3) The same image section as (a1) after imaging the regions in (a2). Due to increased conductivity, this region appears significantly brighter than the rest of the image. (b1–3) HIM images of a cell infected at MOI 1 at different magnifications (FOV 20 µm, 5 µm, and 450 nm) with charge compensation. (c1–3) HIM images of the same cell (FOV 20 µm, 2 µm, and 450 nm) after imaging the magnified sections in (b). (c1) and (c2) were imaged with and (c3) was imaged without charge compensation.

