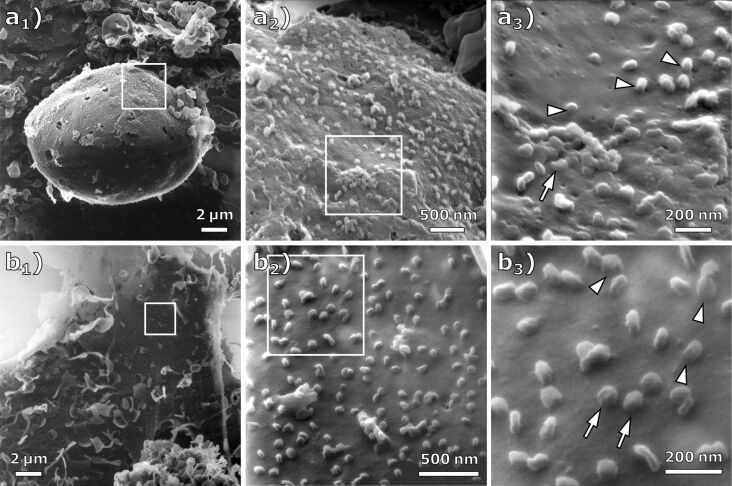
Figure 3.
HIM images of cells infected at MOI 1 imaged with charge compensation. (a1–3) Different magnifications of an infected cell (FOV 17 µm, 3.5 µm, and 1.3 µm). At the high magnification in (a3), clusters of virus particles (arrow) and junctions (arrowheads) between the virus particle and the cell membrane become visible. (b1–3) Different magnifications of an infected cell (FOV 18 µm, 2 µm, and 850 nm). While some of the virus particles appear to be bound to the cell membrane (arrowheads), others seem to just lie on top of it (arrow).

