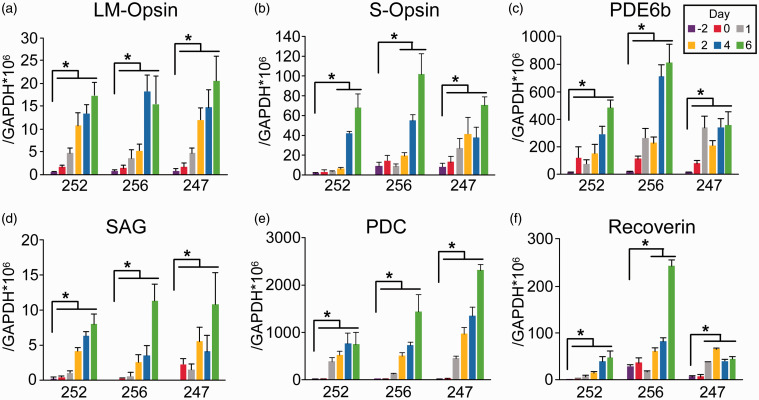
Figure 3.
Induction of photoreceptor marker genes in multiple lines of hRPE cells reprogrammed with ASCL1 and miRNA124. Real-time quantitative RT-PCR measurements of the expression of L/M-opsin (a), S-opsin (b), PDE6b (c), SAG (d), PDC (e), and recoverin (f) in total RNA isolated from three independent lines of hRPE cells (252, 256, and 247) at Days −2, 0, 1, 2, 4, and 6 of reprogramming. Expression levels of the indicated genes were compared to that of GAPDH in the same sample. * P < 0.05, vs. Day −2, unpaired Student's t-test, n = 6 wells from three independent experiments. (A color version of this figure is available in the online journal.)

