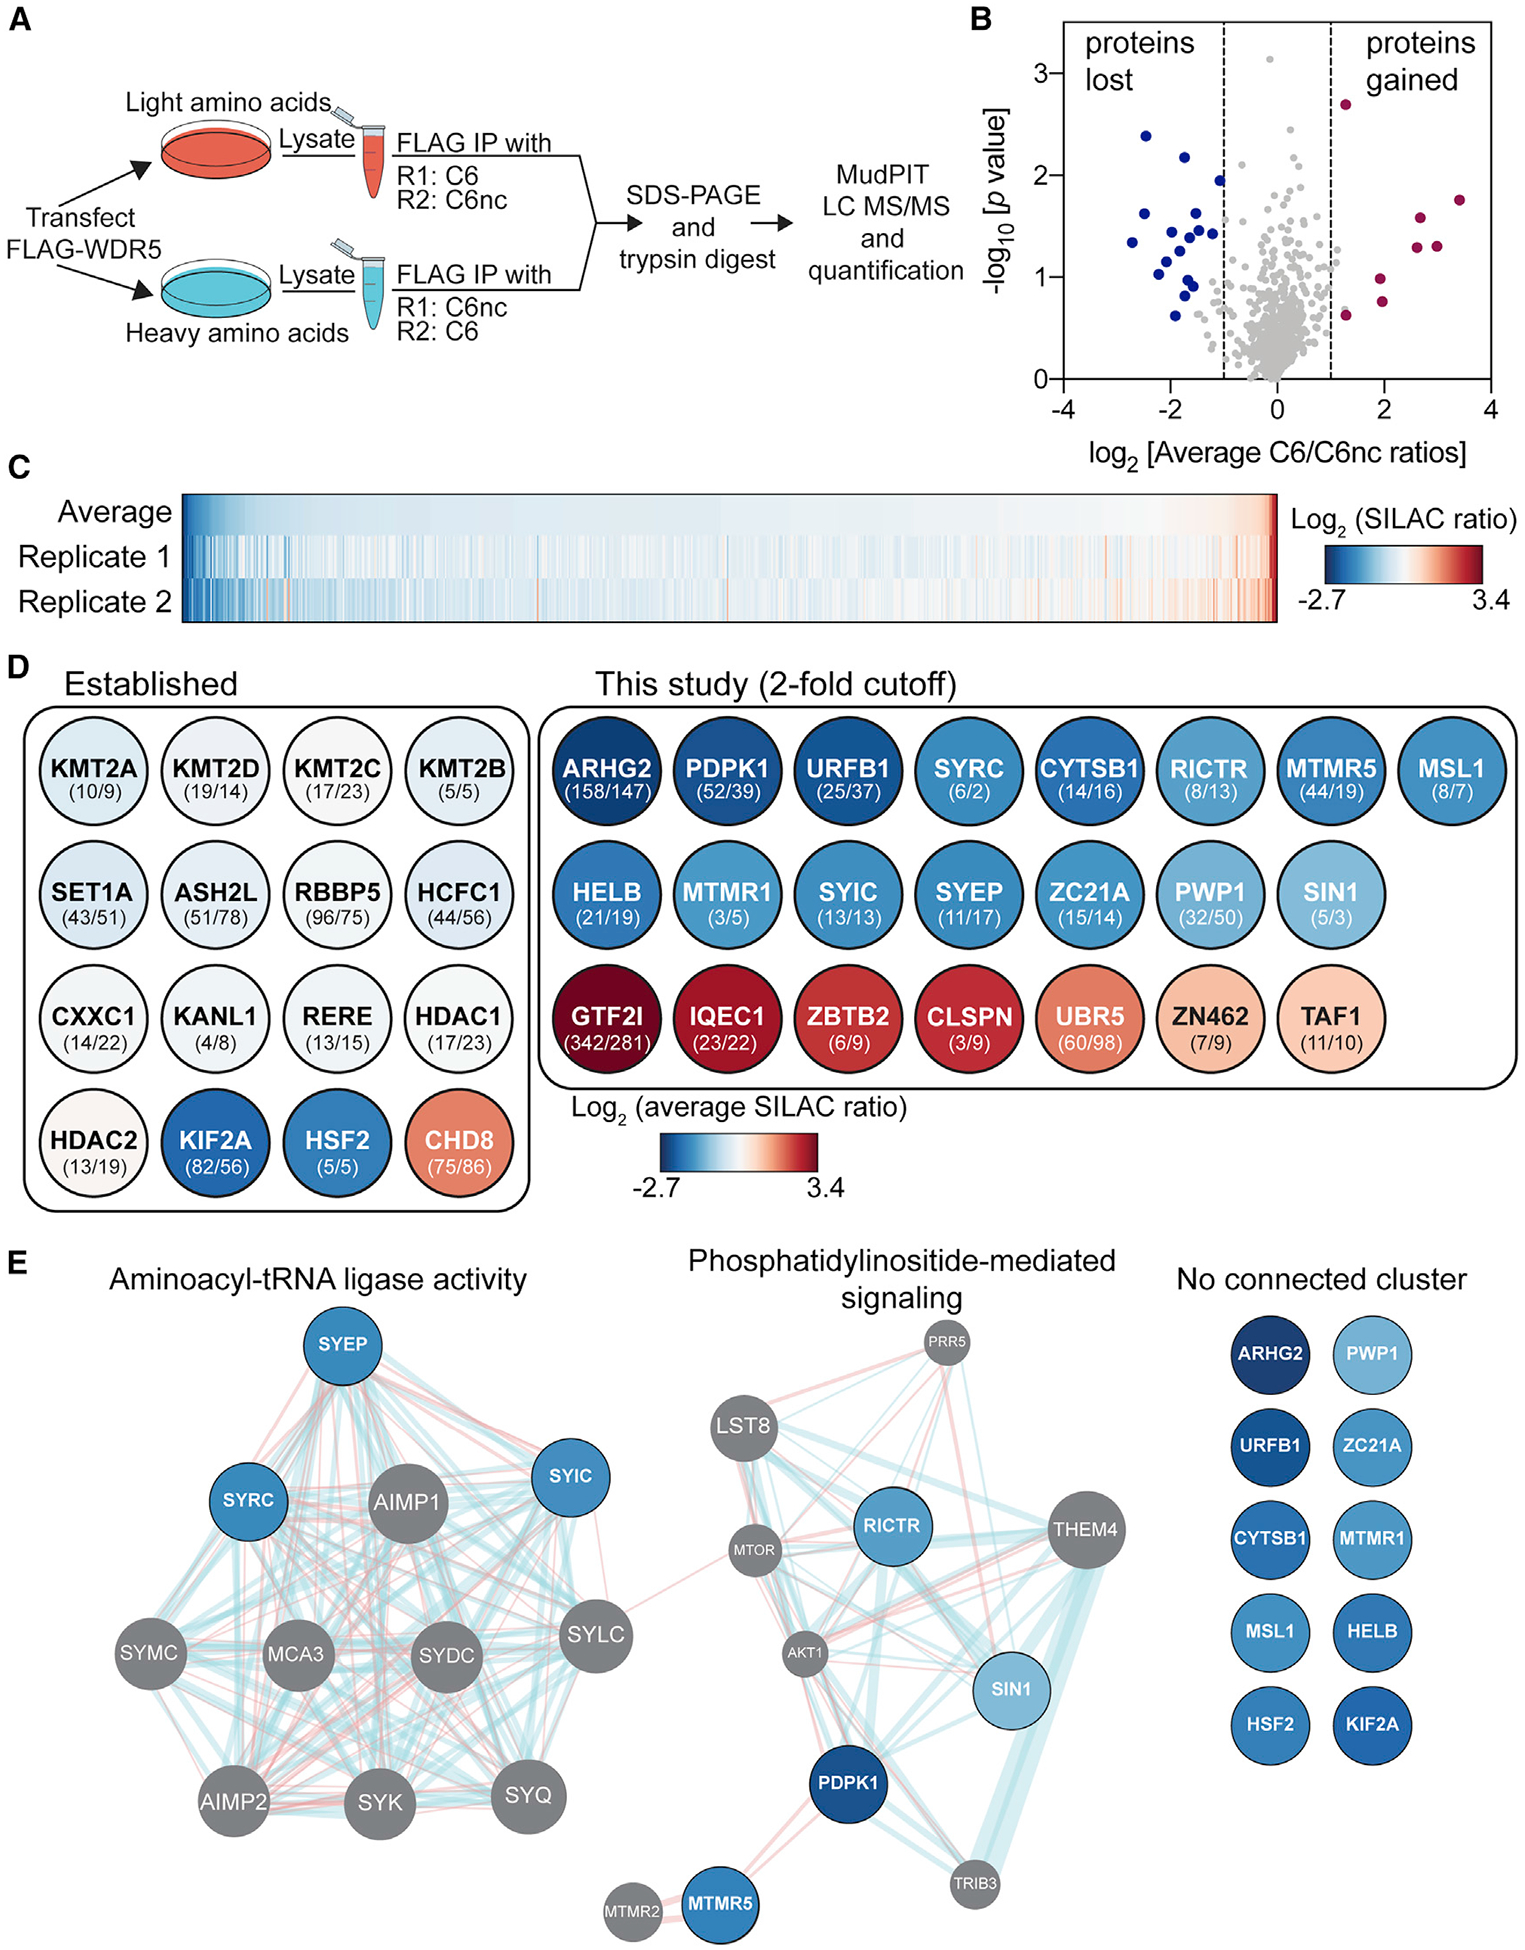
Figure 2. Identification of WDR5 interaction partners that are sensitive to WIN site inhibitor.

(A) Schematic of SILAC setup. The experiment was performed in duplicate (R1 and R2) with label swap.
(B) Volcano plot of the SILAC data plotting log2 (average ratio) against the p value from one-sample t test. Proteins meeting a 2-fold cutoff in both replicates are highlighted.
(C) Heatmap of the log2-transformed SILAC ratios for the 747 proteins quantified in both SILAC replicates and ranked by average ratio.
(D) Impact of C6 on the interaction of established (left) or novel (right) proteins with WDR5. The color of each circle corresponds to the average log2 (SILAC ratio) from the heatmap in (C). Numbers in parentheses are spectral counts from the two replicates (R1/R2). UniProt names are used throughout.
(E) GeneMANIA (Warde-Farley et al., 2010) was used to predict functional nodes among depleted proteins, identifying “aminoacyl tRNA ligase activity” (false discovery rate [FDR] = 2.04e–18) and “phosphatidylinositol-mediated signaling” (FDR = 4.00e–4). Blue lines represent pathway interactions; red lines indicate physical interactions. Gray circles represent proteins identified by GeneMANIA as connected functionally or physically to the 17 input proteins (blue). Proteins on the right failed to cluster.
