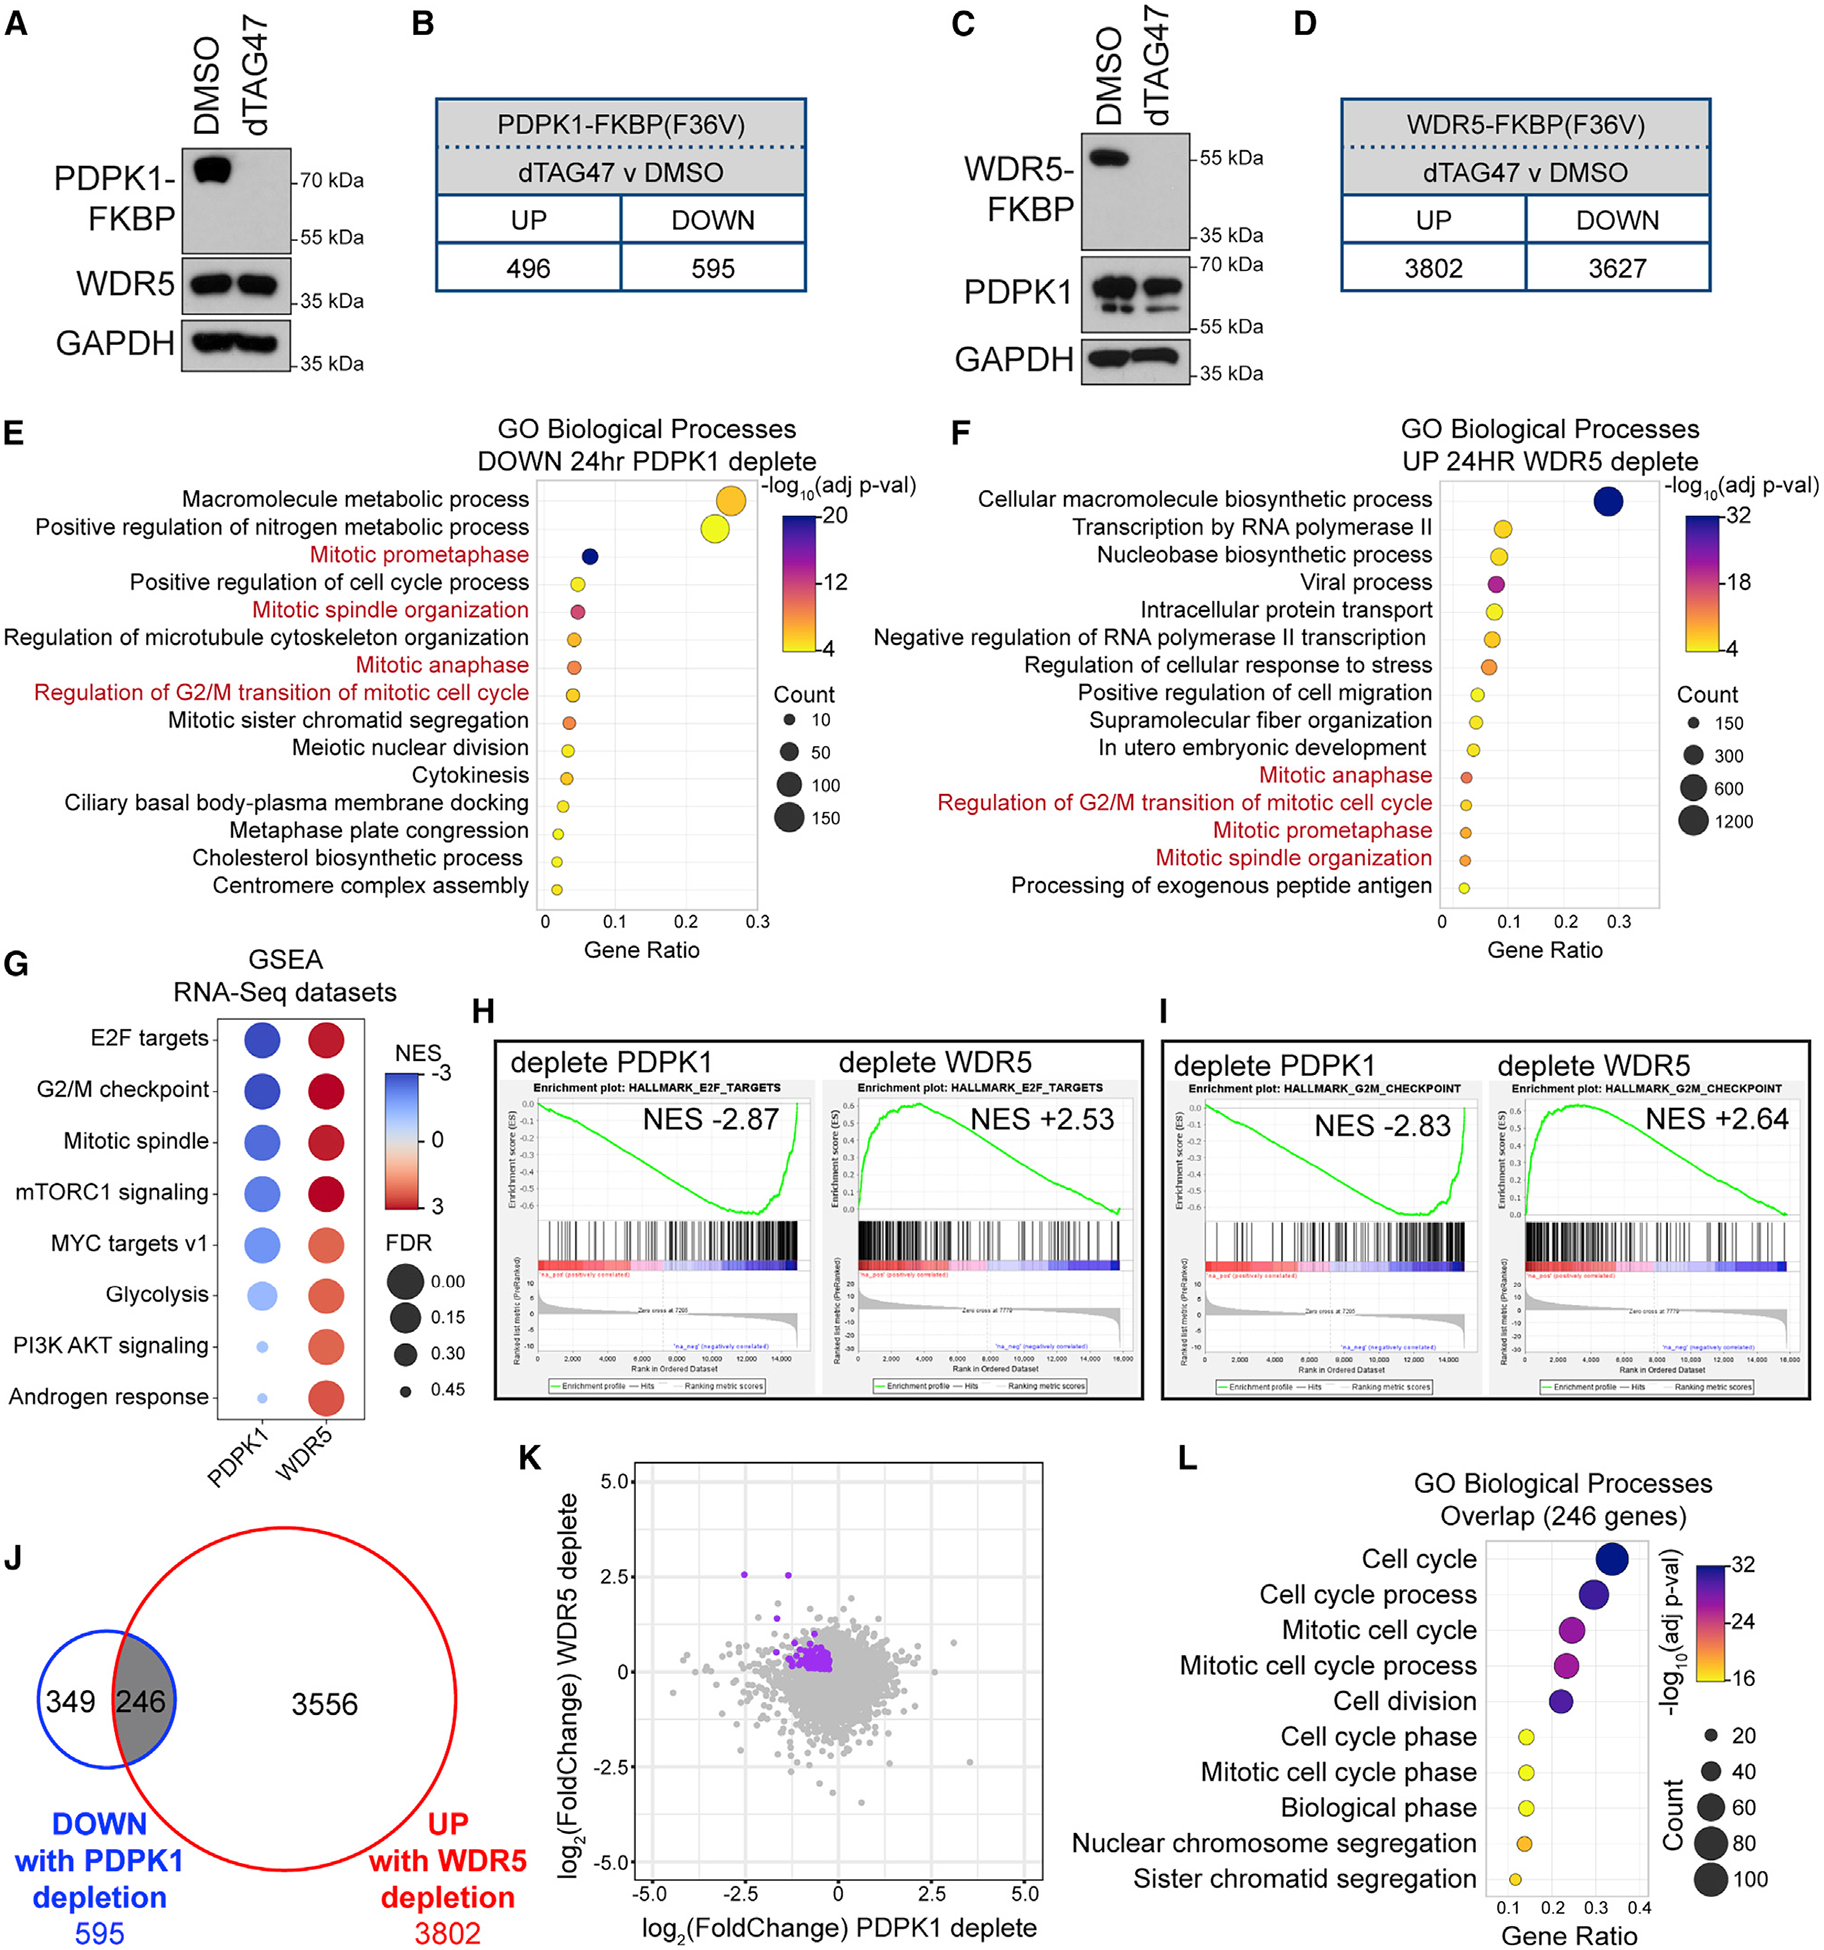
Figure 6. PDPK1 and WDR5 oppositely influence the expression of cell-cycle genes.

(A) U2OS cells expressing PDPK1-FKBP(F36V)-2xHA were treated for 24 h with 500 nM dTAG47 or DMSO, lysates prepared, and PDPK1, WDR5, and GAPDH levels determined by IB.
(B) Number of transcripts significantly (FDR < 0.05) altered by 24-h treatment of cells in (A) with 500 nM dTAG47, compared with DMSO control. n = 3 biological replicates.
(C) As in (A) but for the cells expressing WDR5-FKBP(F36V)-2xHA.
(D) Number of transcripts significantly (FDR < 0.05) altered by 24-h treatment of cells in (C) with 500 nM dTAG47, compared with DMSO control. n = 4 biological replicates.
(E) GO analysis of decreased transcripts identified by RNA-seq of U2OS cells depleted of PDPK1 for 24 h. Biological Process GO terms were ranked by adjusted p value, and the 15 most significant enriched terms are presented; the color indicates the Bonferroni-corrected Fisher exact p value; the size indicates the number of genes in that category; the x axis is the ratio of genes in the category over total analyzed genes.
(F) GO term analysis of increased transcripts identified by RNA-seq of U2OS cells depleted of WDR5 for 24 h. Ranking and presentation are as in (E).
(G) Enriched Hallmark gene sets (Liberzon et al., 2015), determined by GSEA of RNA-seq from 24-h PDPK1 or WDR5 depletion. Eight of the top Hallmarks are shown. Color indicates the normalized enrichment score (NES); size indicates the FDR value.
(H and I) Examples of GSEA enrichment plots summarized in (G). FDR = 0.000 for all plots shown.
(J) Overlap of transcripts that are decreased with PDPK1 depletion and increased with WDR5 depletion.
(K) Scatterplot of RNA-seq data from PDPK1 and WDR5 depletions. The 246 genes from (J) are highlighted in purple.
(L) GO term analysis of the 246 genes represented in (J). Biological Process GO terms were sorted hierarchically, and the most specific subclasses were ranked by adjusted p value. The 10 most significantly enriched subclasses are presented. Presented as in (E).
See also Figure S6.
