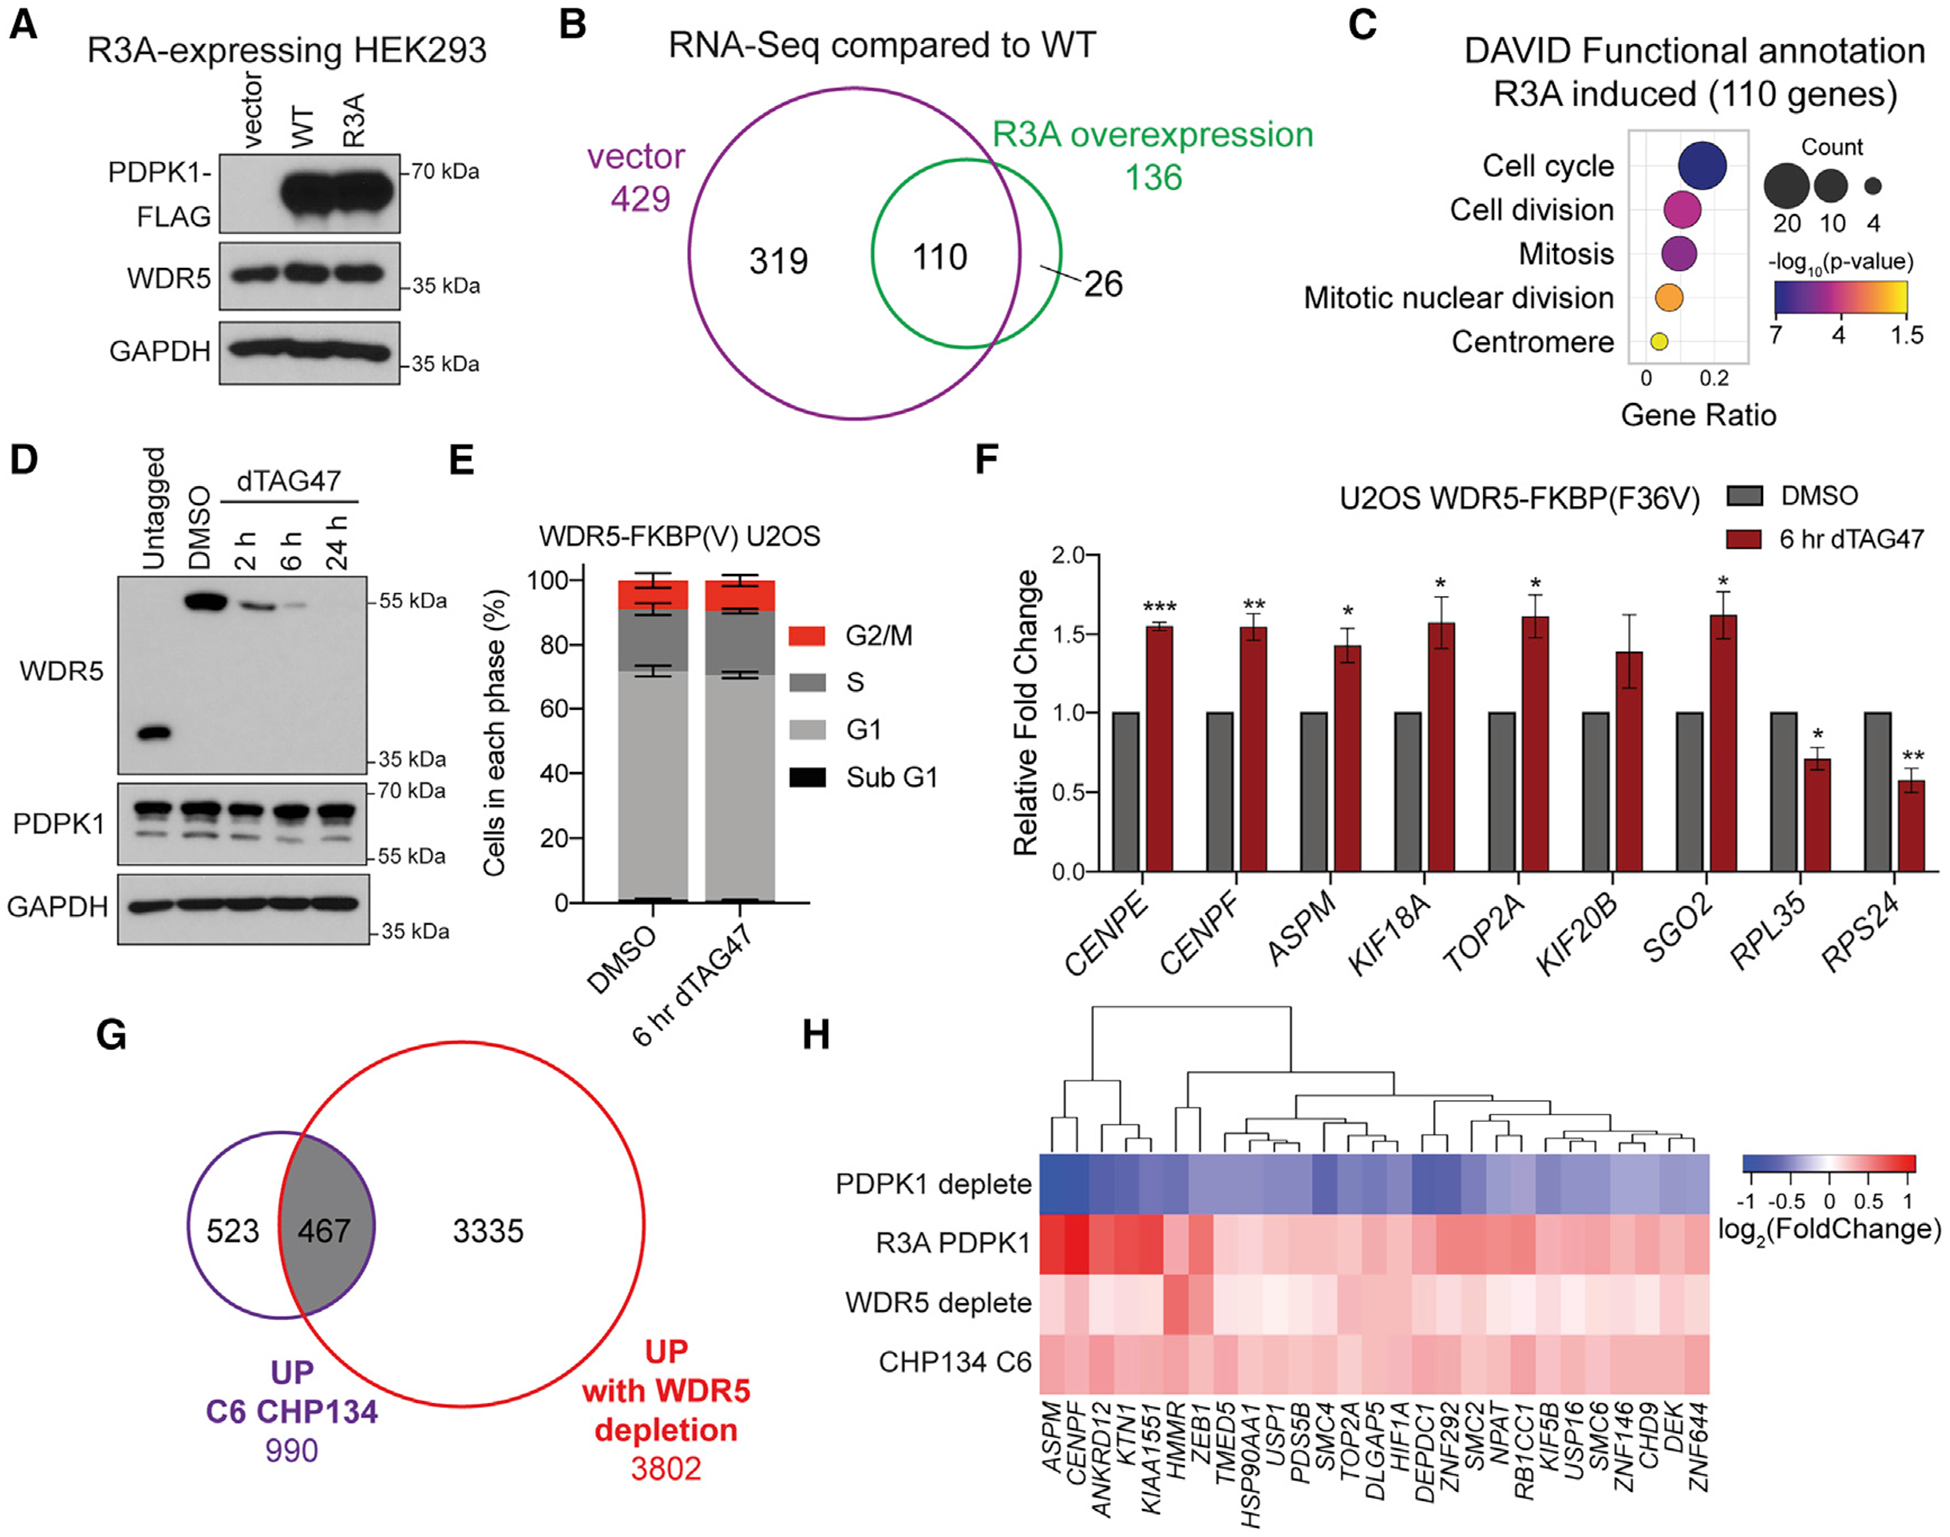
Figure 7. Disrupting the PDPK1-WDR5 interaction induces transcription of cell-cycle genes.

(A) IB of lysates from HEK293 cells expressing the PDPK1 R3A mutant and transduced with vector control, WT, and R3A PDPK1.
(B) Venn diagram of RNA-seq, comparing low-expressing (vector) and high-expressing R3A PDPK1, normalized to WT PDPK1-expressing cells. All 110 transcripts common to both samples are increased. n = 2 biological replicates for each condition.
(C) GO analysis on the 110 overlapping genes performed using DAVID Bioinformatic Resource (Huang et al., 2009a, 2009b); the color indicates the Fisher exact p value; the dot size indicates the number of genes in that category; the x axis represents the Gene Ratio, the ratio of genes in the category to total analyzed genes.
(D) IB of WDR5 depletion time course with 500 nM dTAG47 in U2OS cells expressing WDR5-FKBP(F36V)-2xHA and compared with untagged cells.
(E) Distribution of cell-cycle phases as determined by flow cytometry for WDR5-FKBP(F36V)-2xHA U2OS cells treated for 6 h with 500 nM dTAG47 or DMSO vehicle control. Data are represented as mean ± SEM; no significance between treatments by unpaired two-tailed t test. n = 3 biological replicates.
(F) Nuclear run-on analysis of nascent transcripts from cells treated with DMSO control or 500 nM dTAG47 for 6 h. Signal is normalized to nascent ACTB transcripts. Data are represented as mean ± SEM; n = 3 independent biological replicates. ***p < 0.001, **p < 0.01, *p < 0.05 by unpaired two-tailed t test.
(G) Venn diagram showing the overlap between gene expression changes that are increased with 24-h WDR5 depletion in U2OS cells and increased with 24-h C6 treatment in CHP134 cells (Bryan et al., 2020).
(H) Hierarchical clustering of log2 (fold change) in gene expression for genes significantly decreased for U2OS PDPK1-FKBP(F36V)-2xHA and increased for HEK293 R3A PDPK1, U2OS WDR5-FKBP(F36V)-2xHA, and CHP134 24-h 5 μM C6.
