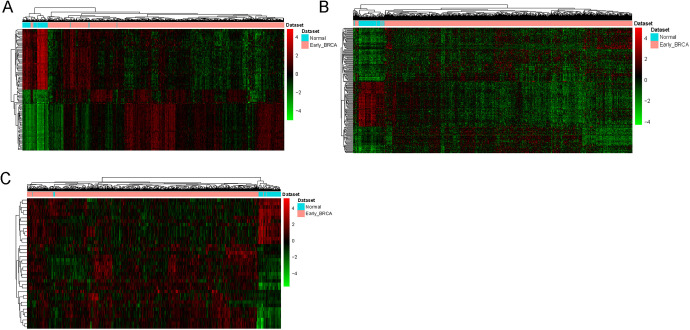
Figure 1.
Hierarchical clustering analysis of top 100 DEmRNAs and all of DElncRNAs and DEmiRNAs between early BC and normal. A, DEmRNAs. B, DElncRNAs. C, DEmiRNAs. Row and column represented DEmRNAs/ DElncRNAs/DEmiRNAs and tissue samples, respectively. The color scale represented the expression levels.

