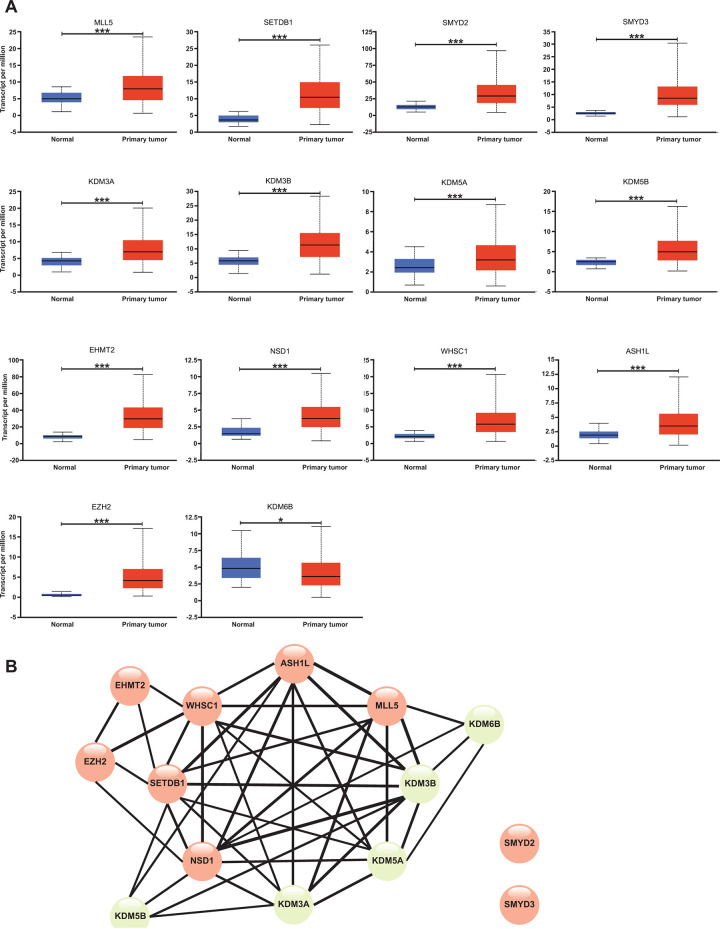
Figure 2.
mRNA expression of 14 methyltransferases/demethylases between HCC and adjacent normal liver tissues, and co-occurrence analysis among these abnormal mRNA expression changes. (A) Relative mRNA expression difference was retrieved from UALCAN. n(Normal) = 50, and n(Primary tumor) = 371. (B) Co-occurrence results of mRNA expression changes in HCC were retrieved from ENCORI. Results with correlation coefficient (|r|) > 0.5 and p < 0.05 were included. Line thickness indicated the magnitude of the correlation coefficients (r). methyltransferases in red; demethylases in green. *p < 0.05, ***p < 0.001.

