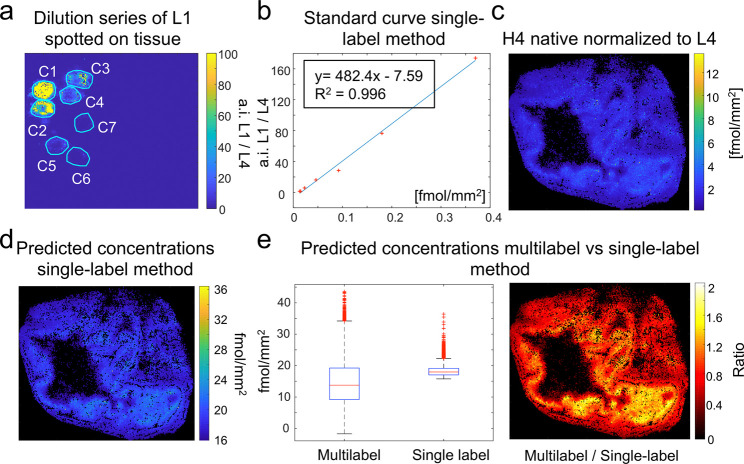
Figure 4.
Comparison of single-label vs multilabel method. A concentration series of label L1 was spotted on a blank colon tissue section (a). Linear regression was used to obtain a calibration curve with an R2 of 0.996 (b). The signal of the target histone H4 peptide on the target tissue was normalized by the signal of label L4, which had been additionally sprayed onto the target tissue (c). (d) Absolute quantities of the histone H4 peptide were calculated by mapping the L4-normalized H4 peptide intensities to the external calibration curve from (b). The predicted concentrations by the single-label and multilabel methods across the tissue section were compared (e). Visualizing the ratios of the predicted concentrations per pixel enabled to localize the main differences between the two methods in the mucosa of the colon (f).

