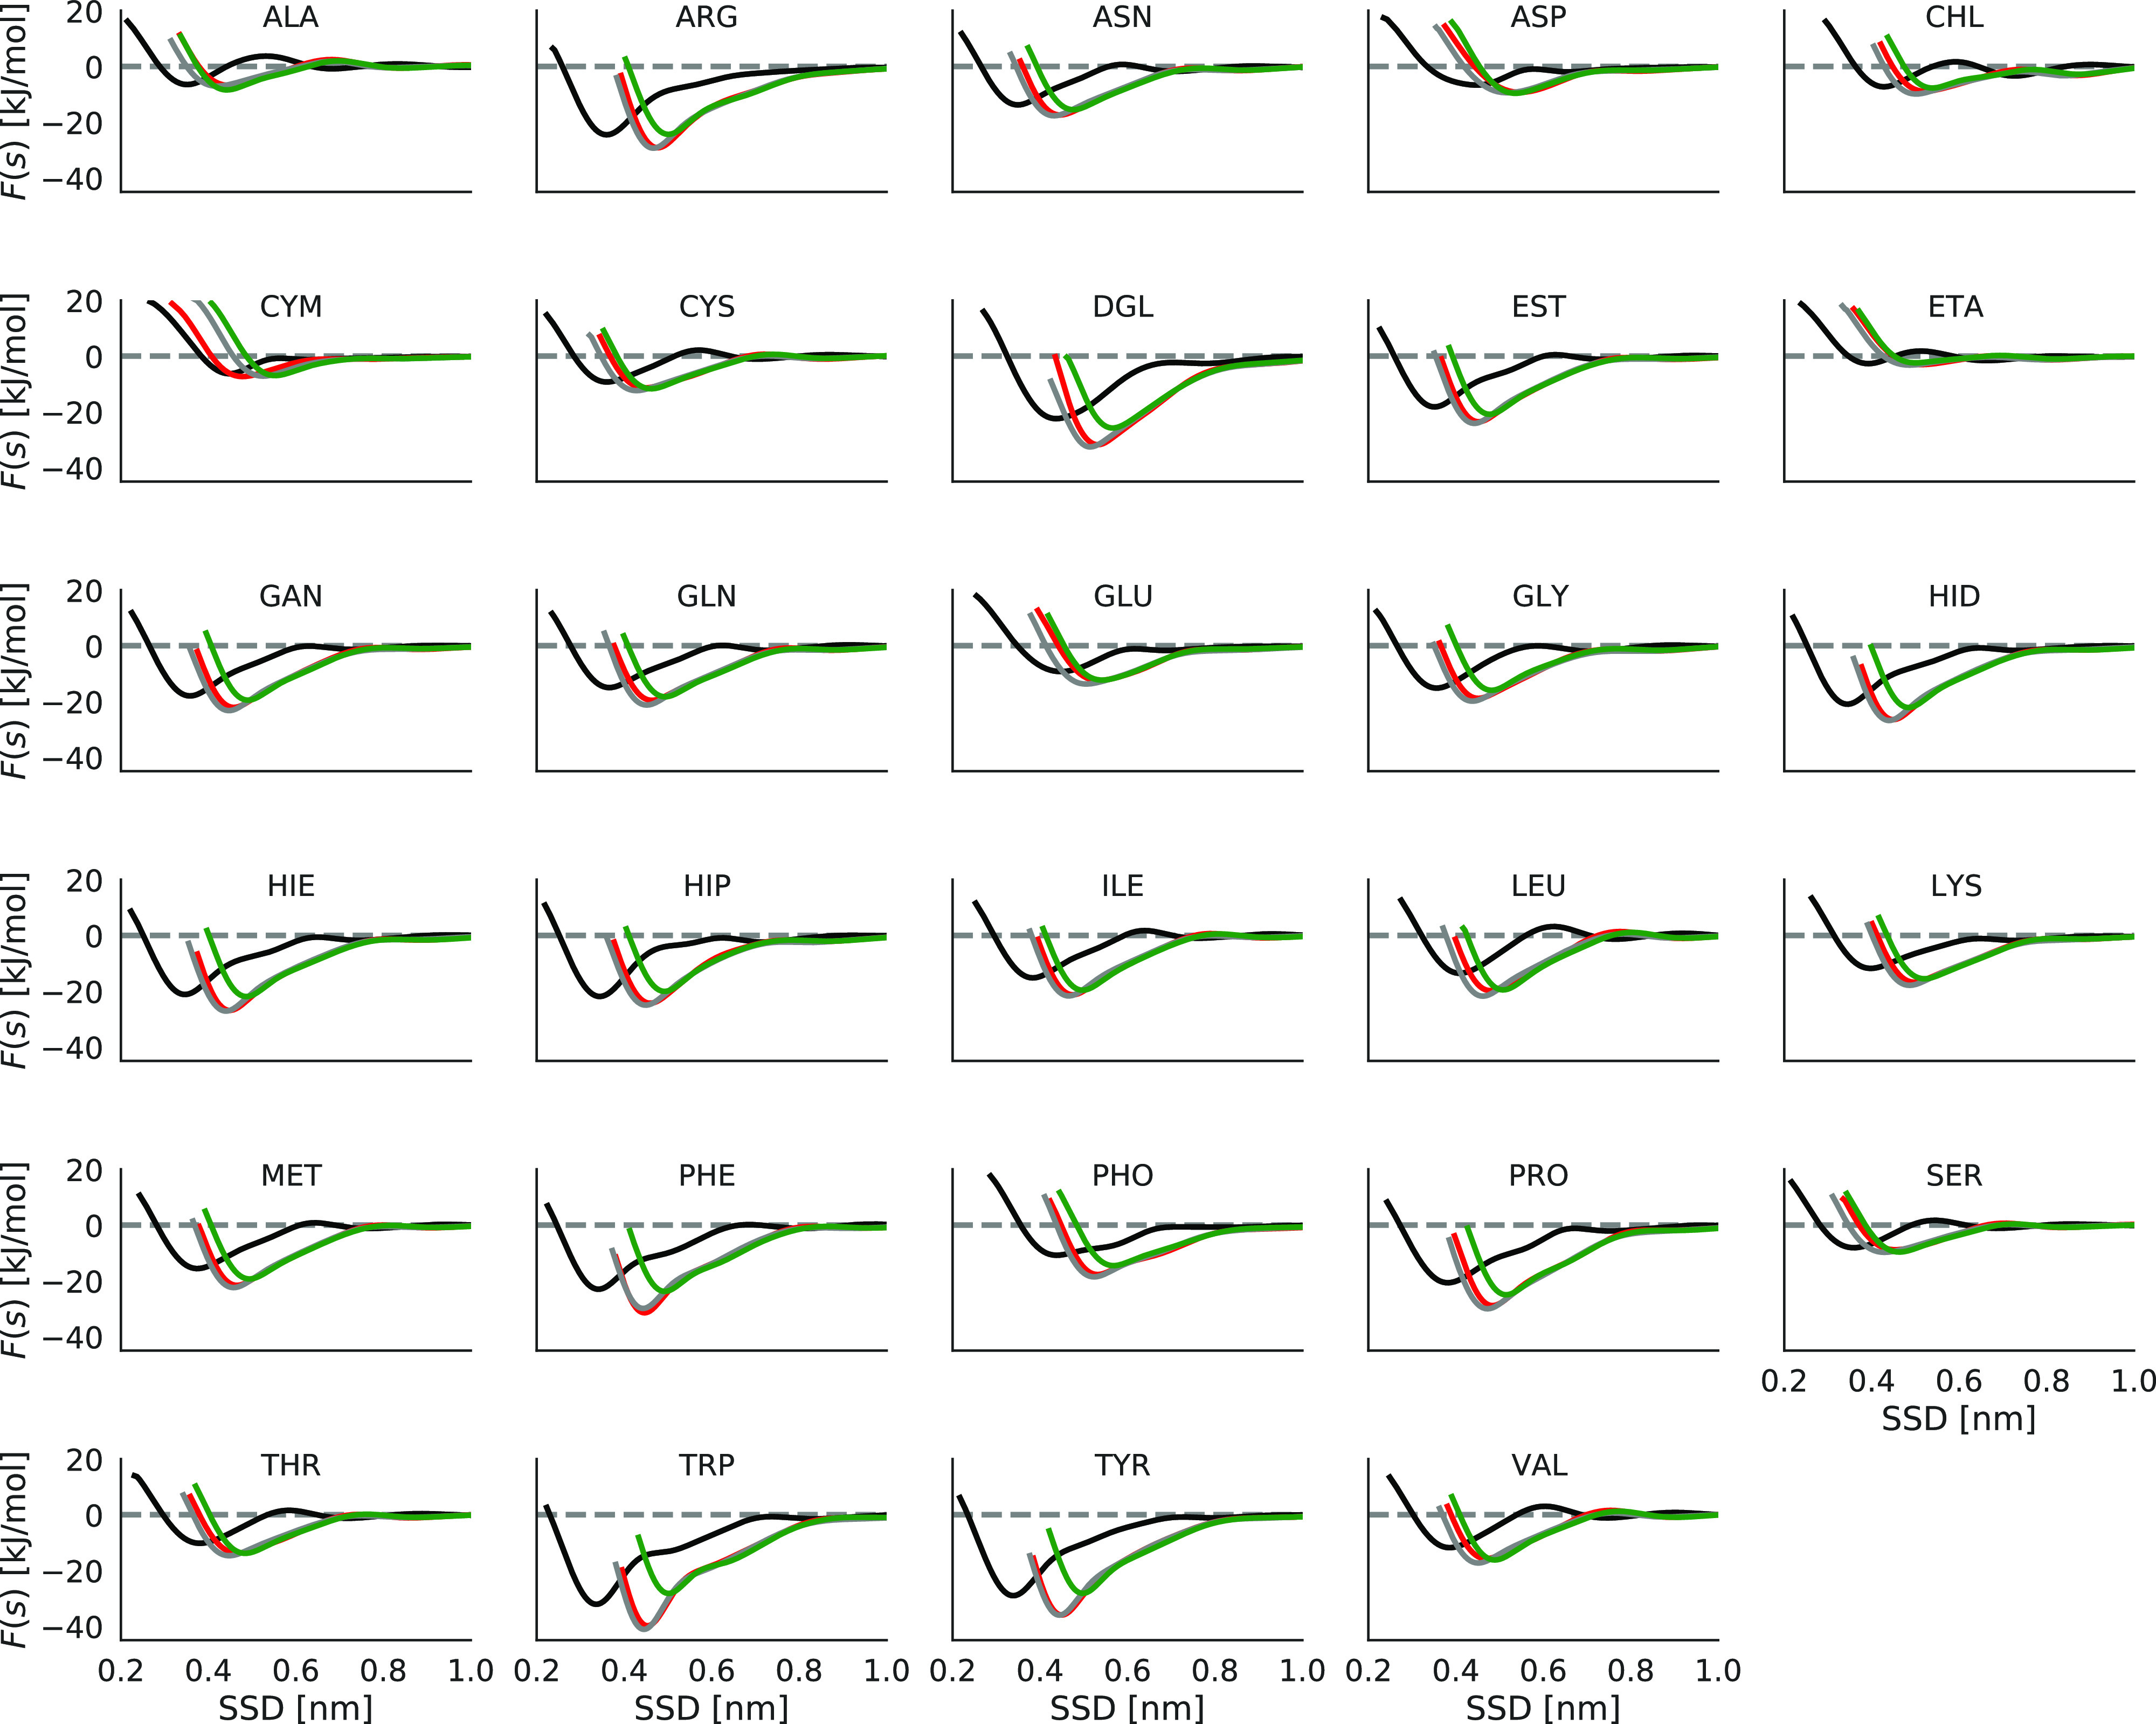
Figure 5.

Adsorption profile of different biomolecules on graphene and different ta-C slabs. Surfaces are colored as follows. Black, graphene; red, green, and gray are three different ta-C slabs.

Adsorption profile of different biomolecules on graphene and different ta-C slabs. Surfaces are colored as follows. Black, graphene; red, green, and gray are three different ta-C slabs.