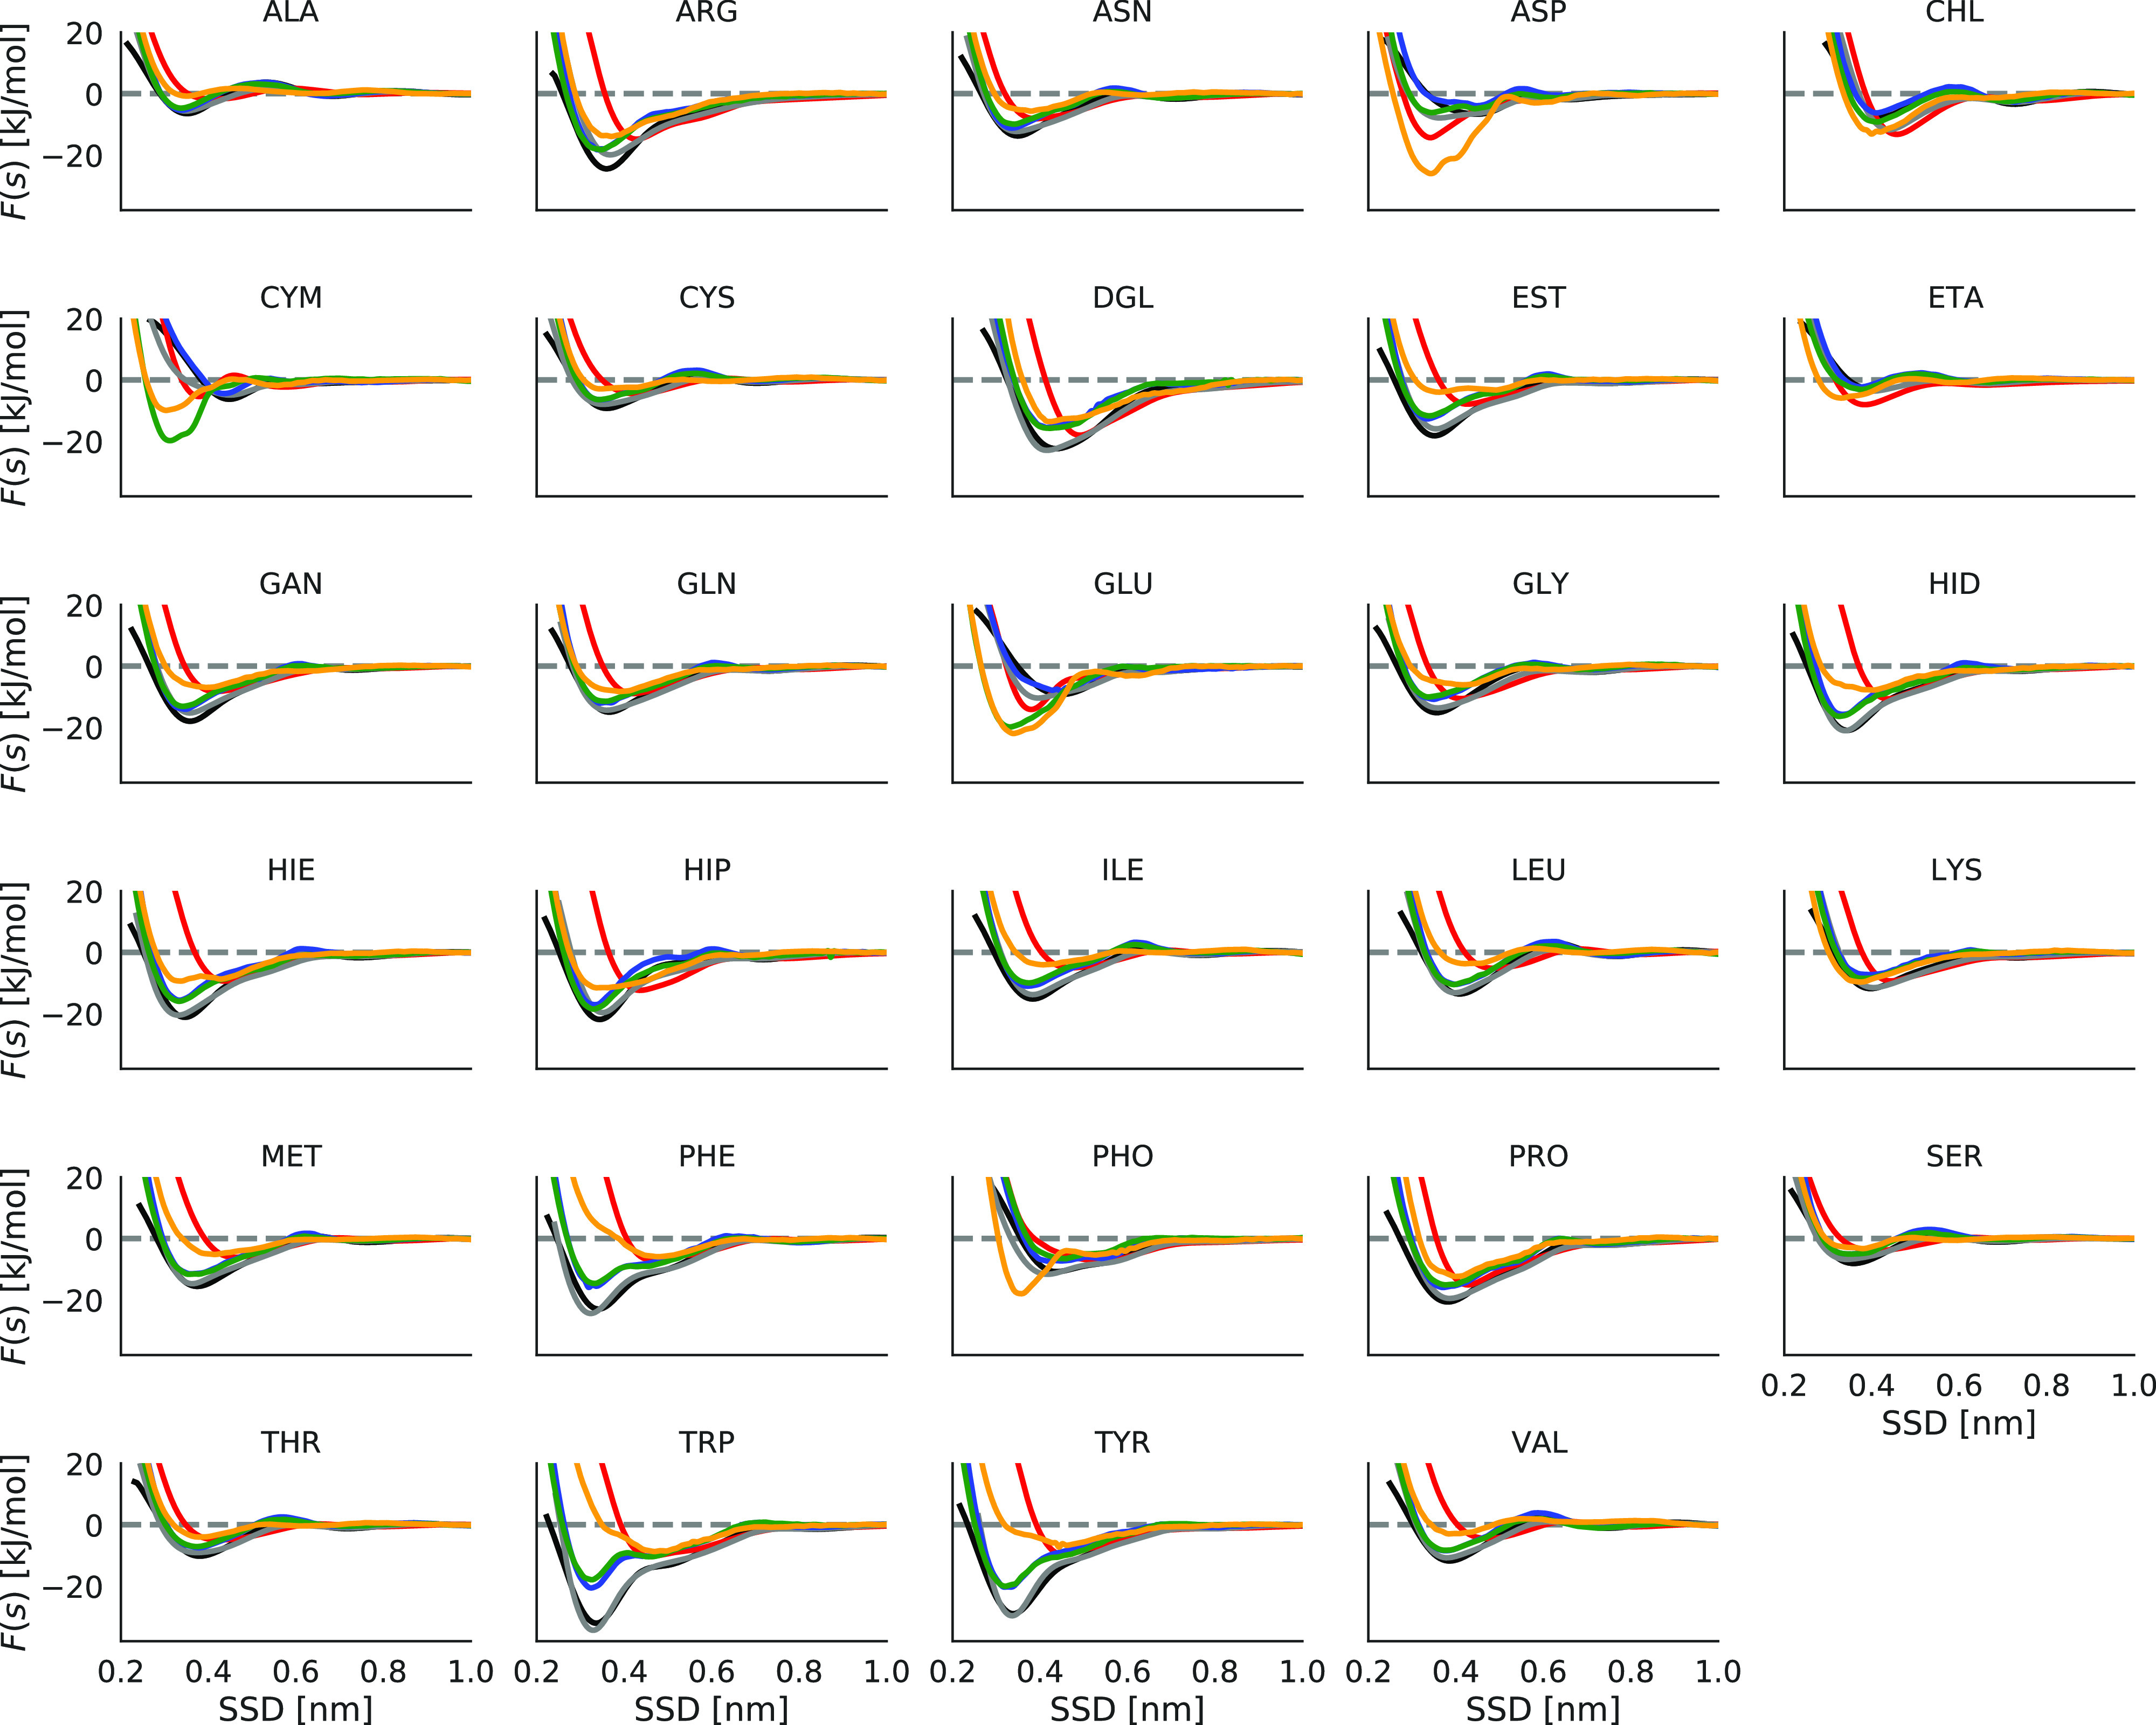
Figure 6.

Adsorption profiles of different biomolecules on various carbon nanomaterial surfaces. Graphene is colored in black, graphene oxide in red, reduced graphene oxide in gray, pristine CNTs in blue, functionalized CNTs with low concentration (0.39 wt %) −OH in green, and functionalized CNTs with high concentration (14 wt %) −OH in orange.
