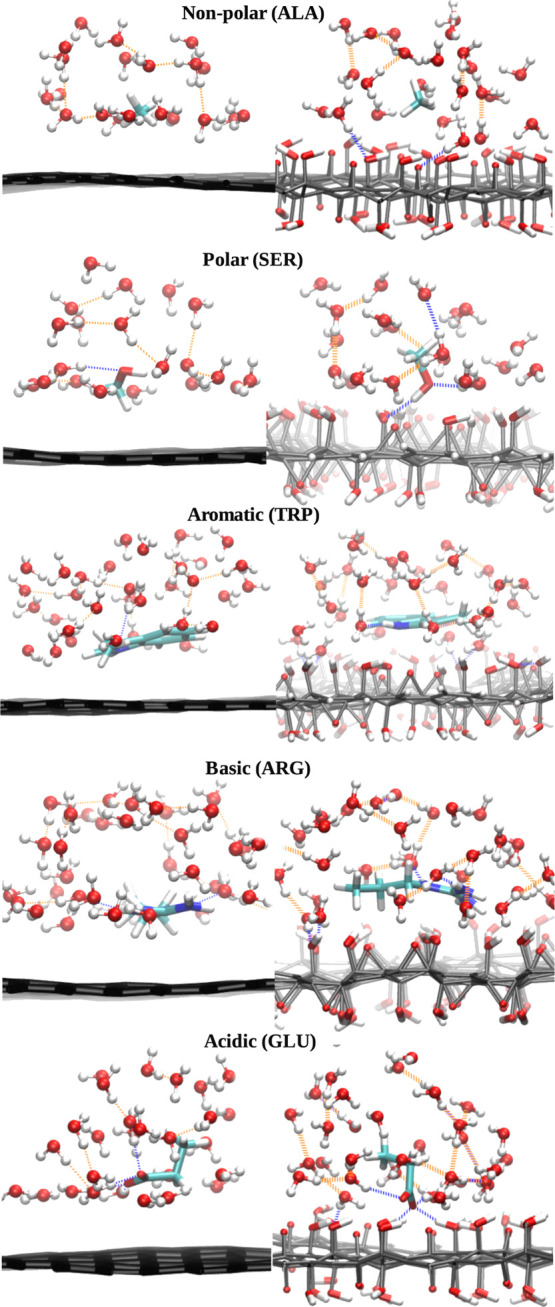
Figure 9.

Representative configurations of absorbed biomolecules of each category (polar, aromatic, etc.) at the free-energy minimum on graphene (left) and graphene oxide (right). Distance between the center of mass of the adsorbing molecule and surface is 0.35 nm and 0.44 nm for ALA; 0.35 nm and 0.39 nm for SER; 0.34 nm and 0.42 nm for TRP; 0.35 nm and 0.42 nm for ARG; and 0.44 nm and 0.35 nm for GLU on graphene and graphene oxide, respectively. Hydrogen bonds between the absorbed biomolecules and carbon nanomaterial or water are shown in blue and the rest are in orange. Snapshots were taken by the funnel fast script developed for metadynamics simulation.66
