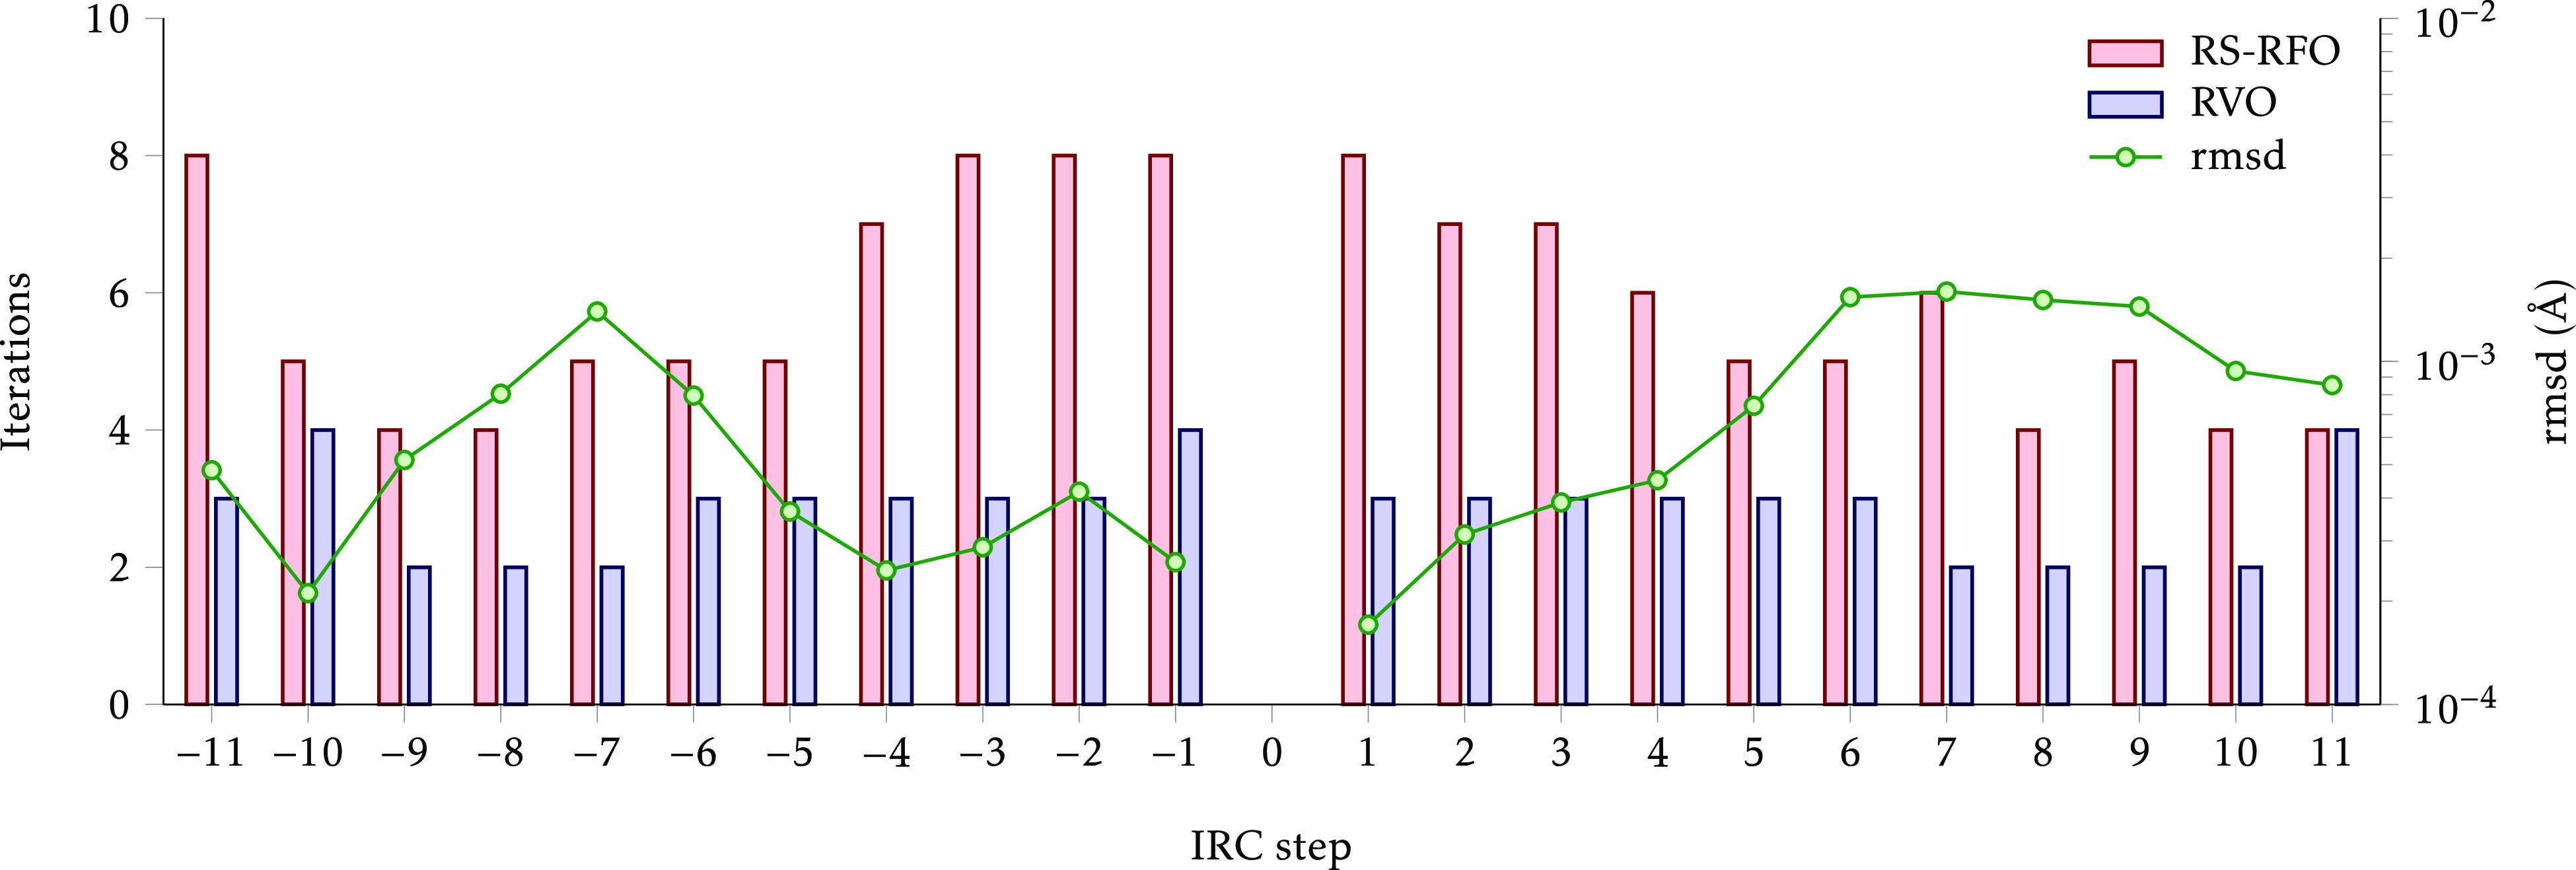
Figure 6.

Comparison of performance for the IRC optimization of reaction #22. The bars show the number of iterations needed for optimizing each step of the path (0 is the initial saddle point, negative steps go toward reactants). The circles represent the root-mean-square displacement between the corresponding optimized structures.
