Figure 1.
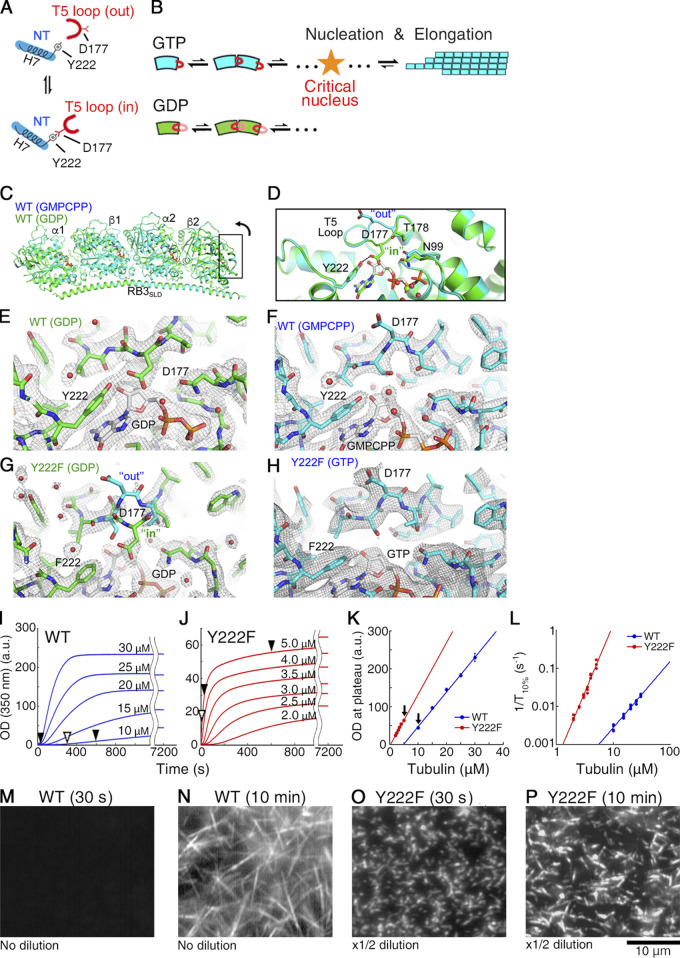
The Y222F mutation modulates the structure of the T5 loop and accelerates nucleation. (A) Schematic picture of the nucleotide-dependent regulation of the T5 loop in β-tubulin (Nawrotek et al., 2011). The “in”/”out” conformation of the T5 loop is regulated by formation/dissociation, respectively, of a hydrogen bond between the D177 residue in the T5 loop and the Y222 residue in H7. GTP/GDP binding biases the structural equilibrium of the T5 loop toward the “out”/”in” conformation, respectively. NT, nucleotide. (B) Schematic picture of the nucleotide-dependent regulation of the pathways of oligomer assembly. Only for GTP tubulin with the T5 loop in the “out” conformation does growth become thermodynamically favorable, as the oligomer exceeds the critical size. (C–H) Drosophila WT (C–F) and Y222F (G and H) tubulin structures within the T2R complex. (C and D) Superposition of the GMPCPP and GDP tubulin structures (C, overview; D, close-up of the part framed in C rotated 90°). (E–H) Two Fobs-Fcalc electron density maps contoured at the 1 σ level and centered on the β2 nucleotide-binding site and T5 loop. In the case of Y222F(GDP) tubulin (G), the T5 loop residue D177 and neighboring residues are not defined in the electron density map, suggesting that this loop is mobile. Both the “in” and “out” conformations of the T5 loop are drawn as a reference. (I and J) Time course of the polymerization of WT (I) and Y222F tubulin (J) monitored by OD350. At times indicated by black arrowheads, the MTs were checked under the darkfield microscope (M–P) and by negative stain EM (Fig. 2, A–C). At times indicated by white arrowheads, the oligomers were imaged using negative stain EM (Fig. 2, E–G; Fig. 4 D; and Fig. 6, A–J). (K) Plateau value of turbidity (I and J) plotted as a function of the initial tubulin concentration, showing the critical concentration (x intercept) of WT and Y222F tubulin to be 4.7 ± 0.5 and 0.19 ± 0.15 (μM), respectively. Error bars represent SD (n = 3–5 for each concentration). The arrows indicate the pair of experiments compared in Fig. 2, E–G. (L) Log–log plot of the inverse of the time required for the turbidity to reach 10% of its plateau value (1/T10%) vs. initial tubulin concentration (Voter and Erickson, 1984). (M–P) Darkfield microscopy images of WT (M and N) and Y222F MTs (O and P). In N, the WT MTs in solution are shown, whereas in O and P, the Y222F MTs attached on the glass surface are shown. Because of the high MT densities, we could not record images of the Y222F MTs in solution using darkfield microscopy.

