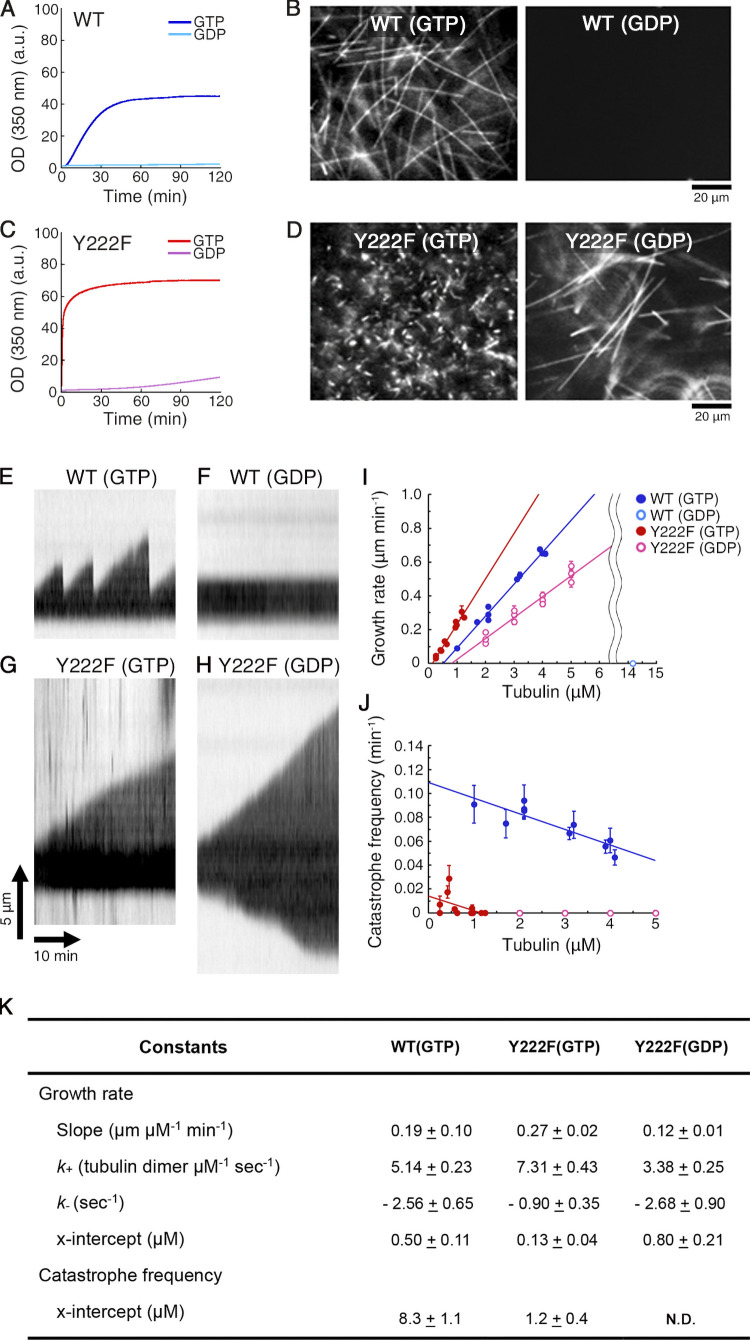
Figure 3.
Assembly of Y222F tubulin in the presence of GDP. (A and C) Time course of polymerization of WT (10 µM; A) and Y222F tubulin (6 µM; C) monitored by OD350. (B and D) Darkfield micrographs of WT MTs (B) and Y222F MTs (D), imaged at the end of reaction (120 min). While WT(GTP) and Y222F(GTP) MTs were diluted for optimal observation of individual MT filaments, Y222F(GDP) MTs were observed without dilution. (E–K) Dynamic instability of individual WT and Y222F MTs. (E and G) Kymographs of WT (E) and Y222F (G) MTs polymerized in the GTP condition (tubulin concentrations of 2.1 and 1.3 µM, respectively). (F and H) Kymographs of WT (F) and Y222F (H) MTs polymerized in the GDP condition (8.4 and 3.0 µM, respectively). (I and J) Concentration dependence of the growth rate (I) and catastrophe frequency (J). In the case of Y222F(GDP), the growth rate and the catastrophe frequency at the plus end are reported. In I, the regression line for WT(GTP), Y222F(GTP), and Y222F(GDP) can be represented by the equations y = 0.19 x – 0.09 (R = 0.99), y = 0.27 x – 0.03 (R = 0.98), and y = 0.12 x – 0.10 (R = 0.97), respectively. Error bars represent SEM. Total number of datasets was 966, 137, and 352 for WT(GTP), Y222F(GTP), and Y222F(GDP), respectively. In J, total time of elongation per data point was 112–2,491 min, with error bars showing SD. The regression line for WT(GTP) and Y222F(GTP) can be represented by the equations y = –0.013 x + 0.109 (R = 0.88) and y = –0.012 x + 0.014 (R = 0.46), respectively. (K) Kinetic and thermodynamic parameters calculated from the data shown in I and J. Values represent the mean ± SD. For details of statistical analysis, see Materials and methods.

