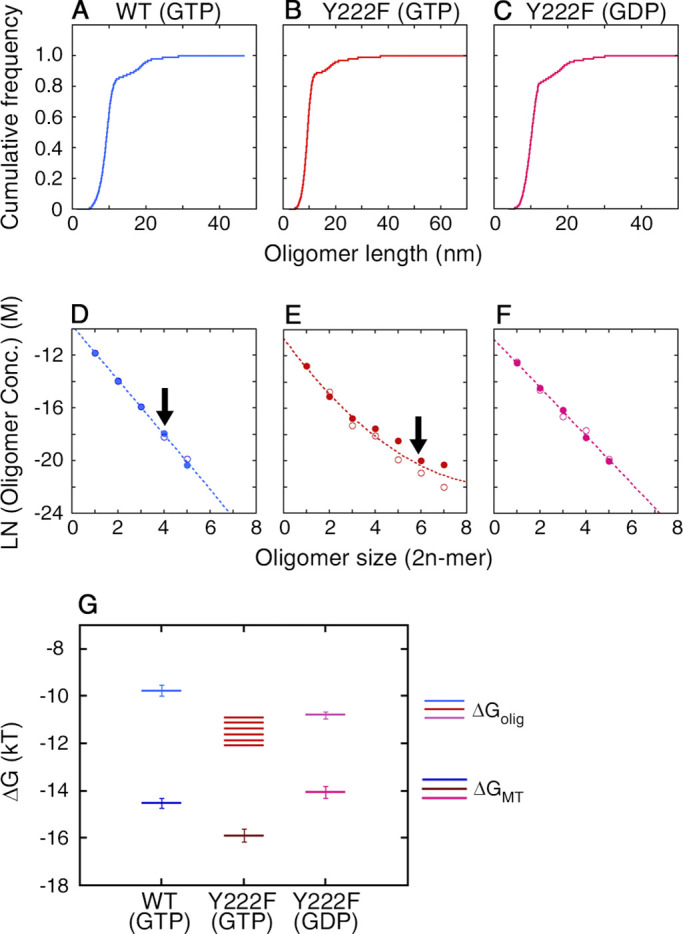
Figure 5.

Size distribution of oligomers. (A–C) Cumulative frequency of the length, calculated from the length distribution presented in Fig. 4 D. (D–F) Logarithm of the concentration of the oligomers, calculated from the probability of oligomers with different sizes (see Materials and methods for the details of the calculation). The measurement was made twice for each type of tubulin (represented by filled and open circles). The raw data for the first round of measurement are shown in Fig. 4 D. For the second round of measurement, n = 10,945, 11,803, and 11,092 for WT(GTP), Y222F(GTP), and Y222F(GDP), respectively. For both WT(GTP) and Y222F(GTP) tubulins, the largest oligomer was only one unit larger than the size of the critical nucleus, indicated by arrows. The data for the WT(GTP; D) and Y222F(GDP) oligomers (F) showed the exponential decay of the oligomer concentration with size, which can be fit by the equations y = –9.75 – 2.07 x (R = 0.99) and y = –10.79 – 1.83 x (R = 0.99), respectively. In the case of the Y222F(GTP) oligomers (E), the concentration of oligomers with n > 3 was significantly higher than the concentration expected from simple exponential decay and was best fit by the equation y = –10.65 – 2.36 x + 0.12 x2 (R = 0.98). (G) The free energy change associated with the binding of tubulin dimer to oligomer (ΔGolig) and MT (ΔGMT). The error bars for each ΔGMT represent the errors estimated from the SD of k+ / k− (see Materials and methods for details of calculation). Conc., concentration.
