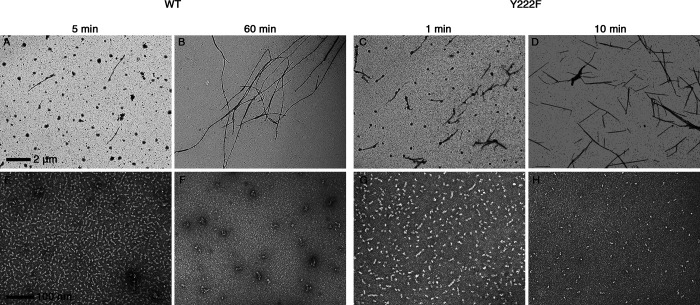
Figure S2.
The number of oligomers decreased with the progress of MT assembly. EM images of WT MTs (A and B) and oligomers (E and F), Y222F MTs (C and D) and oligomers (G and H) recorded in the course of polymerization (Fig. 1, I and J). The initial concentrations of tubulin were 10 µM (WT) and 5 µM (Y222F). The photographs of MTs and oligomers were taken at 2,500× and 40,000× nominal magnification, respectively. For Y222F mutant tubulin, only the dimers and aggregates are seen at 10 min, which is when the turbidity reached ∼90% of the plateau value (H). In contrast, for WT tubulin, the oligomers and aggregates existed at 60 min, which is when the turbidity reached a plateau (F).

