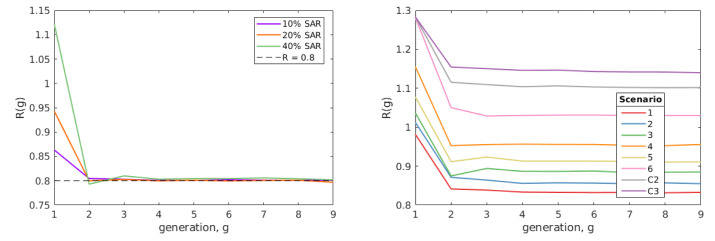
Figure 2. Numerical exploration of R by generation.
Left shows examples of the method for which ε was fitted to satisfy R(4) = 0.8 under our baseline parameters for different values of SAR HH. Right shows R(g) by generation from each of our scenarios from our baseline assumption. In both plots, R(g) decreases over the first few generations, before reaching an equilibrium value that persists over multiple generations.

