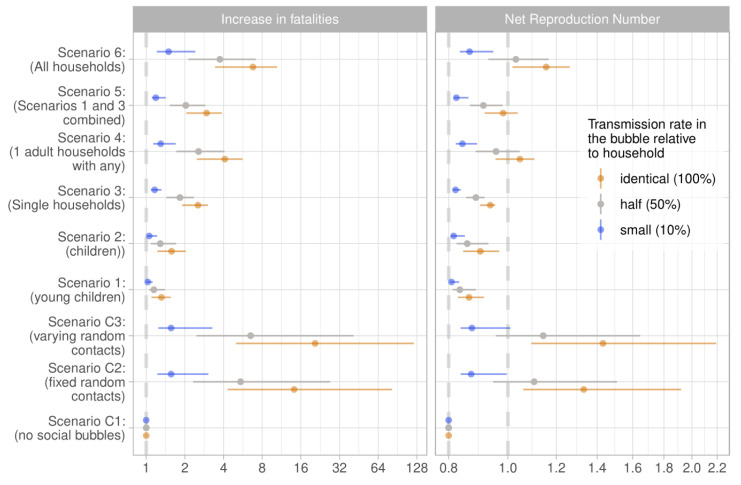
Figure 3. Estimated reproduction number and increase in fatalities for the considered scenarios under the assumption that all eligible households pair up and thereby form exclusive social bubbles and that transmission rates within a social bubble are the same as within the household.
Central estimates are assuming SAR HH=20% and the upper and lower limits represent the respective 10% and 40% assumption.

