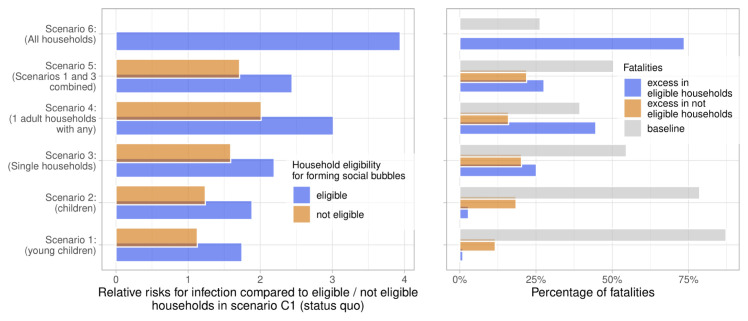
Figure 6. Relative risk of infection and fatality.
Left panel: the relative risks for infection in the considered scenarios if compared to the status quo with no social bubbles (Scenario C1), stratified into the risks in households eligible and not eligible for forming social bubbles. Right panel: the population attributable fraction of fatalities in the considered scenarios. The overall mortality risk is stratified into the baseline risk, and the excess risk from forming social bubbles in both eligible and non eligible households.

