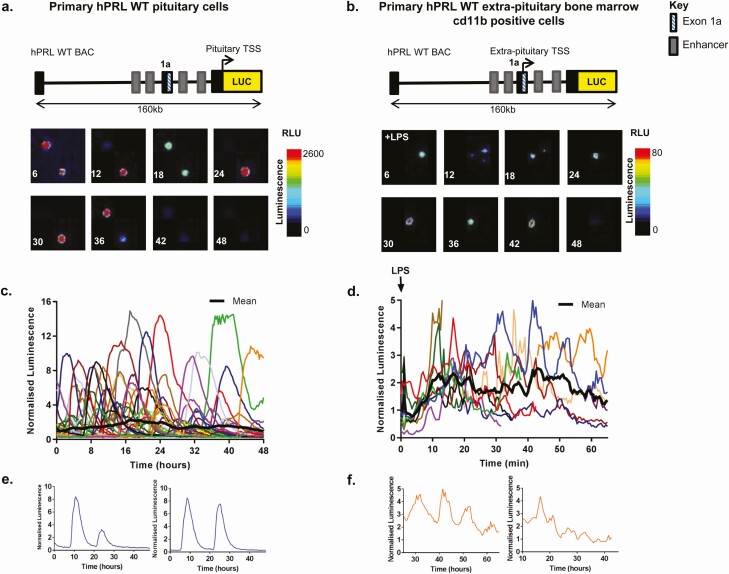
Figure 1.
Contrasting cycles of hPRL transcription directed by the alternative and proximal promoters. Luminescence signal from primary pituitary (A) and bone marrow myeloid cells (following treatment with 0.05% LPS) (B), taken from transgenic rats expressing luciferase under the control of a 160 kb hPRL genomic fragment (hPRL WT BAC). Colored lines represent data from single cells, (C) n = 45 cells and (D) n = 12 cells) and thick black line represents the population mean. Example single cell traces from pituitary cells (E) and bone marrow myeloid cells (F). Luciferase activity from each cell was normalized to the average luminescence intensity of all cells in each imaging experiment at time zero.

