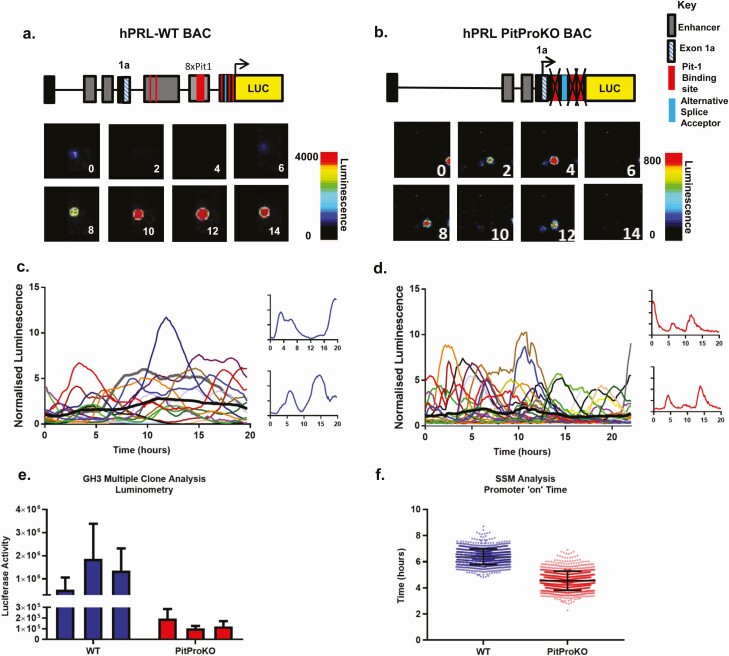
Figure 4.
Bursting gene transcription of the hPRL alternative promoter. Single cell transcriptional activity in GH3 hPRL WT and PitProKO cell lines. Representative images and single cell transcriptional traces from hPRL WT (A and C) and hPRL PitProKO cells (B and D). Colored lines represent data from single cells with the thick black line representing the mean response of the population; n = 16 (C) and n = 28 (D). Luciferase activity from 3 individual hPRL WT and 3 hPRL PitProKO clonal GH3 cell lines (E). Luciferase activity from each cell was normalized to the average luminescence intensity of all cells in each imaging experiment at time zero. Estimated transcriptional “on” time determined by SSM compared between hPRL WT and PitProKO cells. Bars show standard deviation of the cycle length from 56 and 69 cells, respectively, in 3 experiments per cell type. The duration of an “on phase” is significantly reduced in PitProKO cells (Kolmogorov-Smirnov, *P < 0.05) (F).

