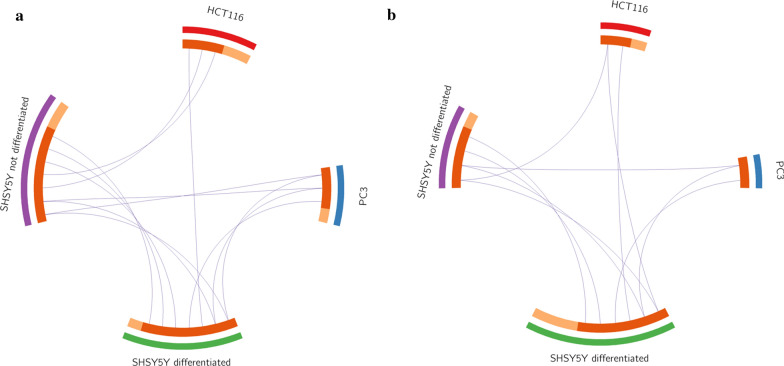
Fig. 5.
Circos plot of the phosphorylated substrates (a) and of the phosphorylated kinases (b). The Circos plots show how phosphorylated substrates (a) and phosphorylated kinases (b) in the different cell lines overlap. On the outside, each arc represents the identity of each cell line. On the inside, each arc represents a phosphorylated substrate, where each substrate has a spot on the arc (cell line). Dark orange color represents the phosphorylated substrates that appear in multiple cell lines and light orange color represents phosphorylated substrates that are unique to that cell type. Purple lines link the same phosphorylated substrate that is shared by multiple cell lines. The greater the number of purple links and the longer the dark orange arcs implies greater overlap among the phosphorylated substrate

