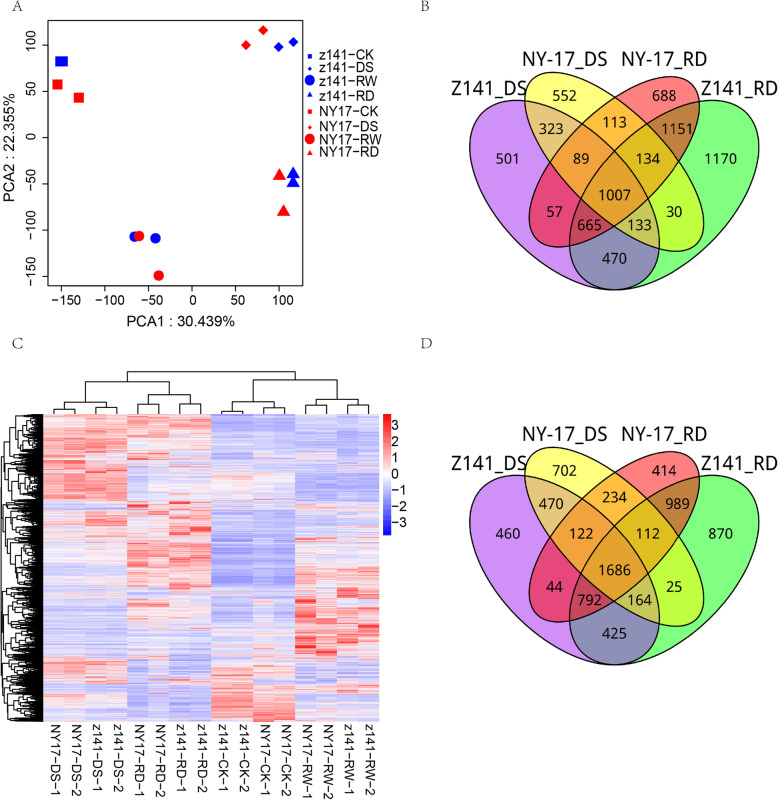
Fig. 2.
Comparative analysis of transcriptome profiles of linseed seedling leaves under DS and RD. a Principal component analysis (PCA) of mRNA populations from the control, DS, RW and RD groups. Each sample contained two replicates. Principal components (PCs) 1 and 2 account for 30 and 22% of the variance, respectively. The PCA plot shows four distinct groups of mRNA populations. Group I: Z141 CK (blue square) and NY-17 CK (red square); group II: Z141 DS (blue diamond) and NY-17 DS (red diamond); group III: Z141 RW (blue circle) and NY-17 RW (red circle) and group IV: Z141 RD (blue triangle) and NY-17 RD (red triangle). b Hierarchical clustering of DEGs exhibiting altered expression levels in response to CK, DS, RW and RD treatments. The colours in the scale (blue (low), white (medium) and red (high)) represent the normalized expression levels of differentially expressed DEGs. c, d Venn diagrams showing overlap of up- (c) or downregulated (d) genes in response to the four assayed abiotic stresses: Z141-DS (purple), NY-17-DS (yellow), Z141-RD (green) and NY-17-RD (red)

