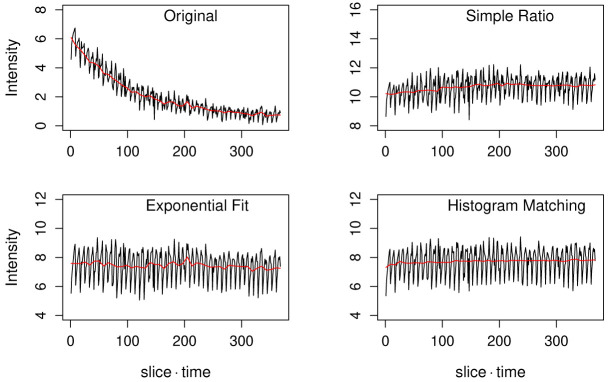
Figure 1. Time course of photobleaching in the original sample sequence (top-left) and corrected curves by the simple ratio method (top-right), the exponential fit method (bottom-left), and the histogram matching method (bottom-right).
For the original and the histogram matching results, values were subtracted by 68 to set the y-axis range to a comparable level to the other two curves. Black curves are the mean intensity of each image and red curves are the mean intensity of each time point.

