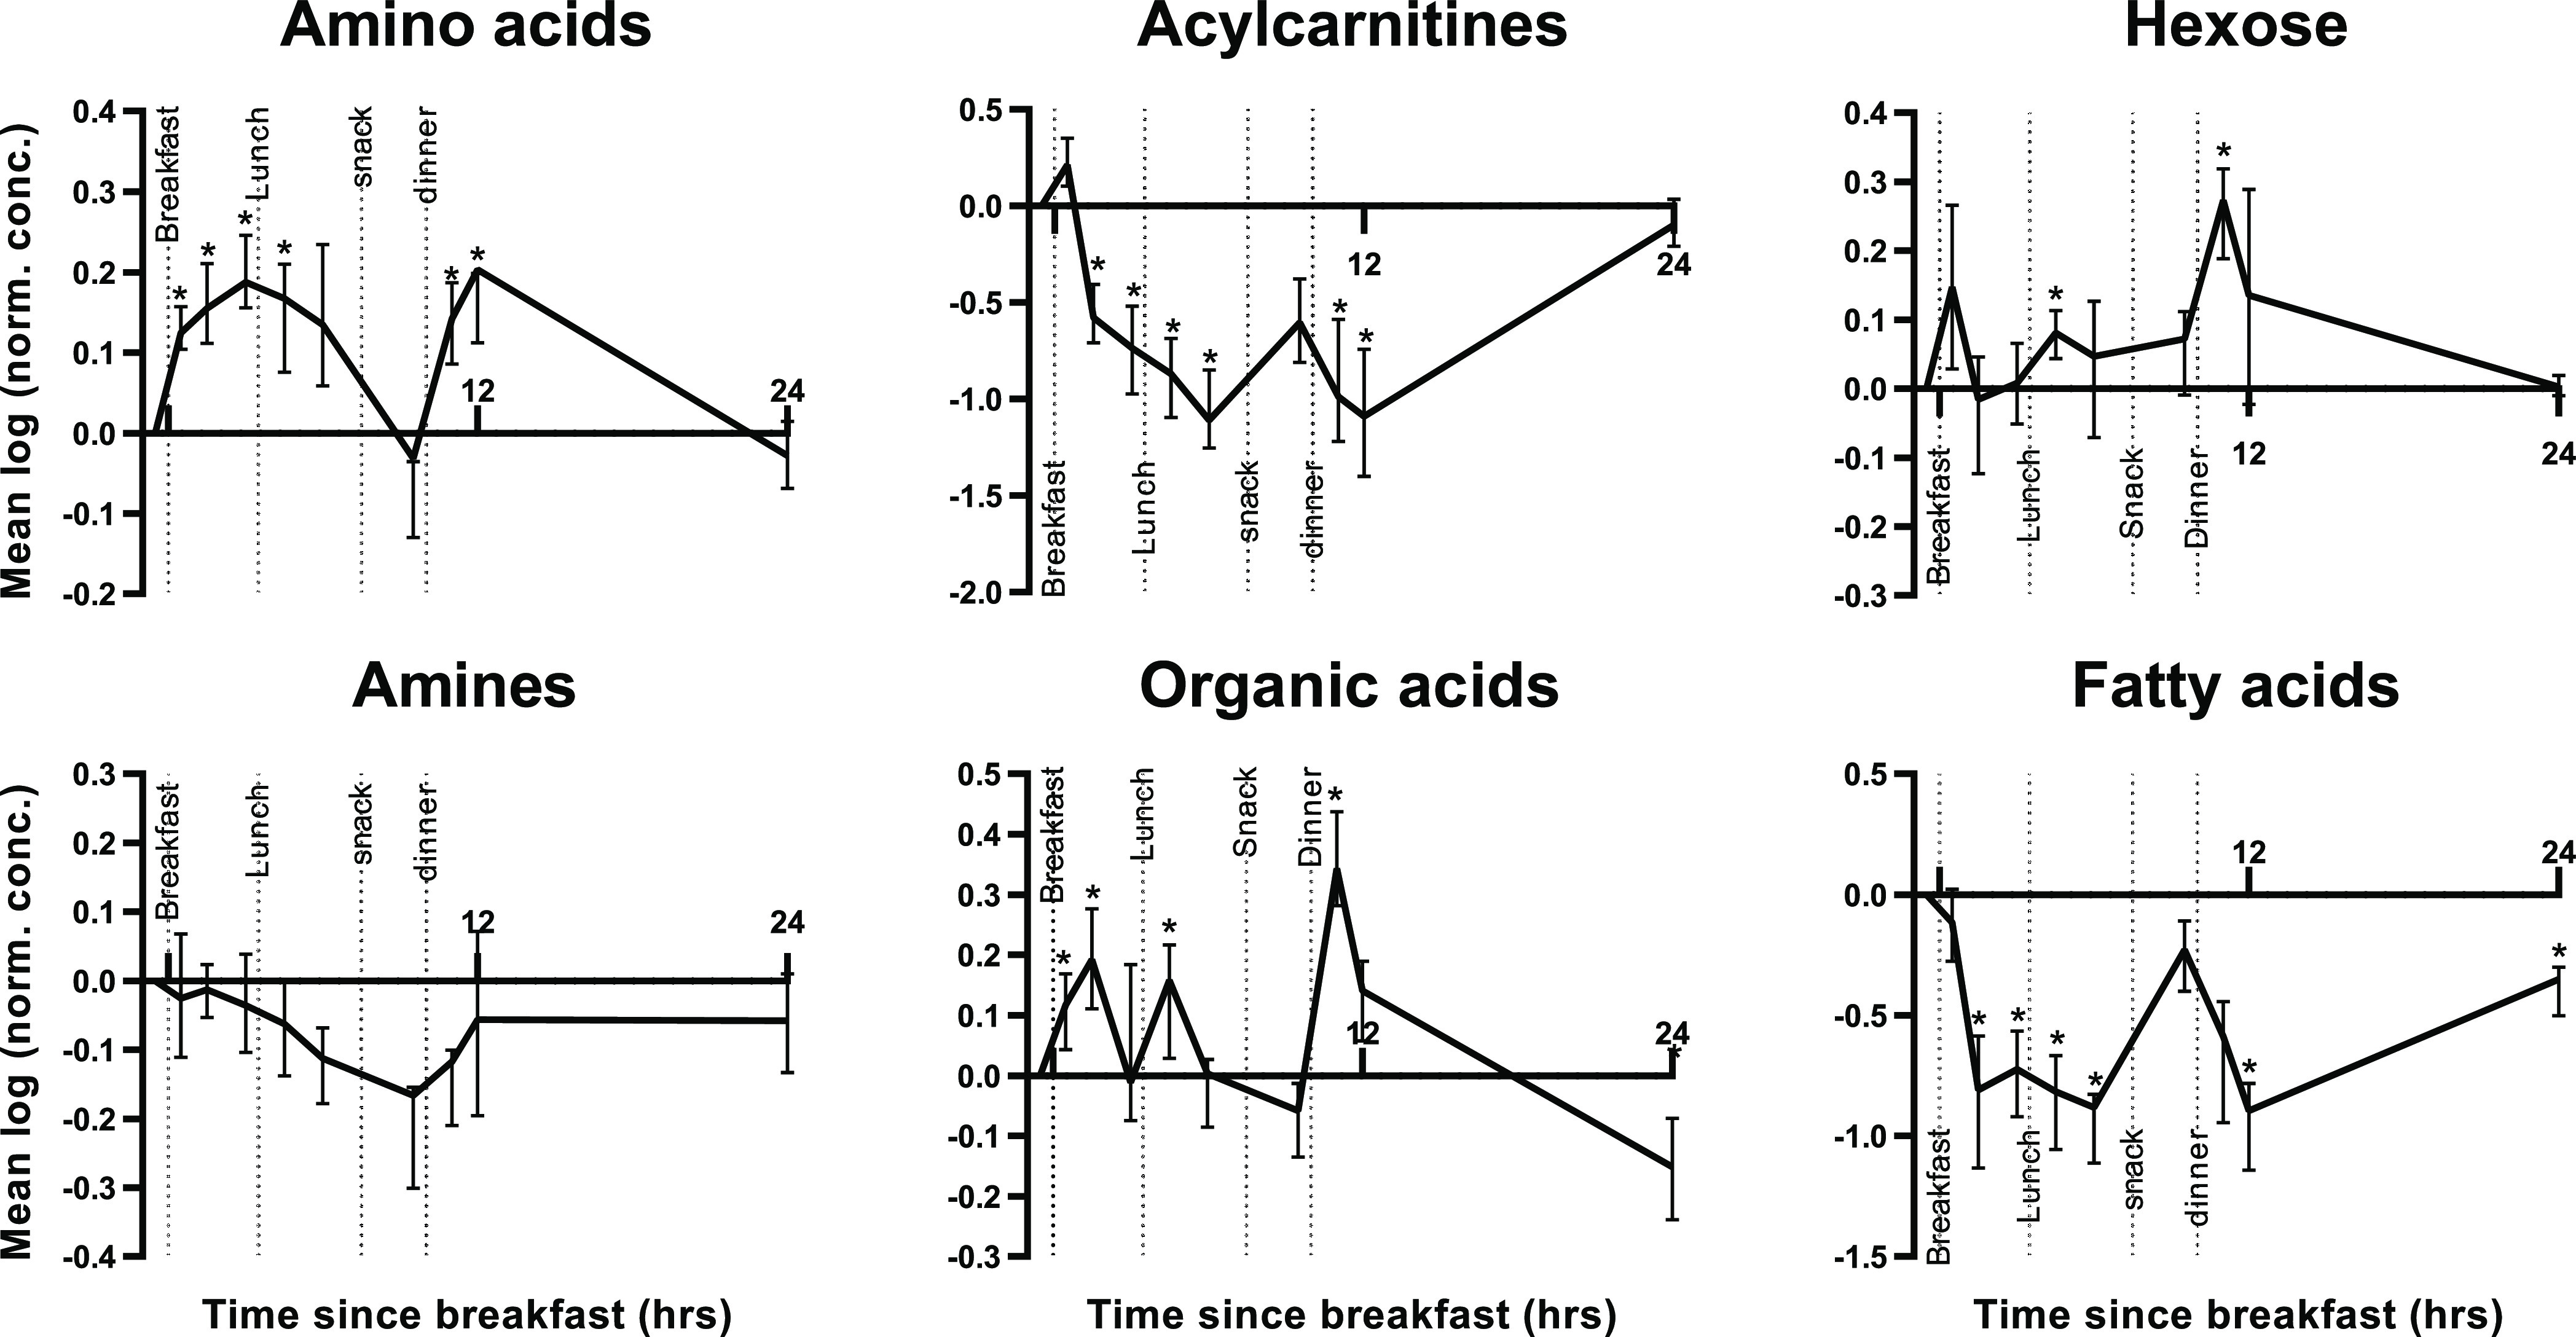
Figure 4.

Mean natural logarithm of metabolite concentrations over time. Normalization was performed on the first time point. Within each compound class, metabolites were averaged per time point and volunteer. The mean of these curves over the 10 volunteers are depicted and the pointwise interquartile range (IQR) of the volunteers is presented in the error bars. Time points that are significantly different from the baseline are indicated (* FDR adjusted p-values <0.1). The time frame comprises four standardized feeding times and meals and one night rest. The time is presented with respect to the breakfast time. Individual trends are shown in the SI Figure S3.
