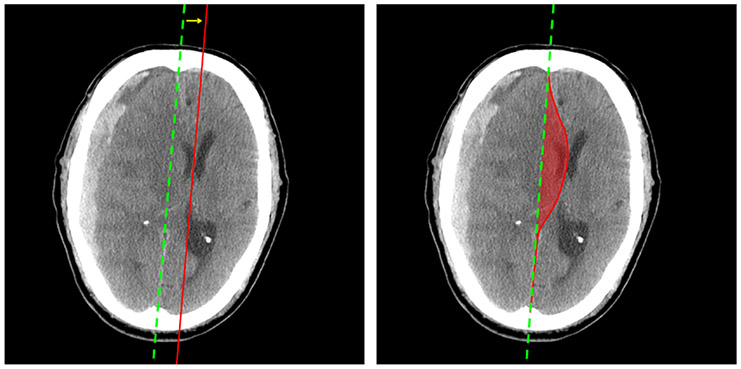
Fig. 1:
Examples of MLS and MSS on one CT image. In each image, the green (dotted) line is the ideal midline (i.e. brain midline without an injury). In the left image, the red line is the actual midline. In the right image, the voxels enclosed by the ideal midline and the annotated curve contribute to the MSS.

