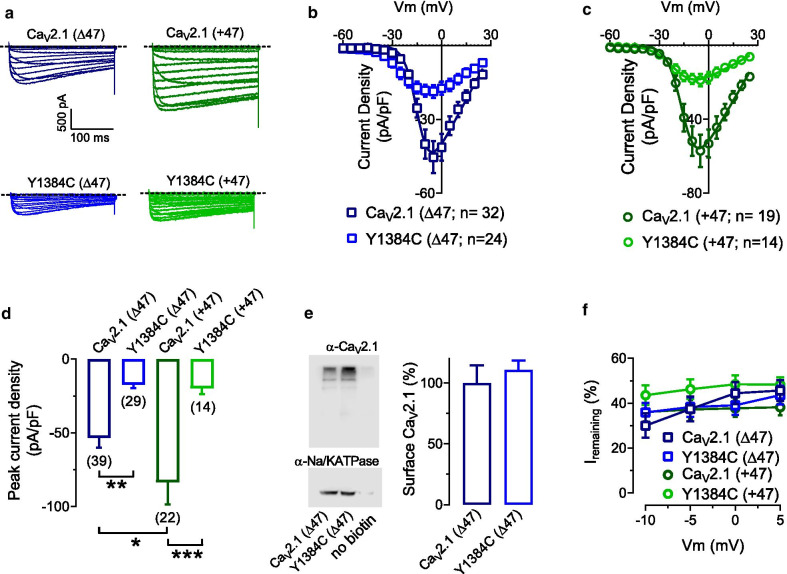
Fig. 2.
Average current densities of CaV2.1 (Δ47), Y1384C (Δ47), CaV2.1 (+ 47) and Y1384C (+ 47) channels. a Representative whole cell Ca2+ current traces recorded in response to depolarizing steps from − 60 mV to + 30 mV from a holding potential of − 100 from tsA-cells expressing either CaV2.1(Δ47), Y1384C (Δ47), CaV2.1(+ 47) or Y1384C (+ 47) α1 subunit with CaVβ4 and CaVα2δ-1. b Average current density–voltage relationships for cells expressing CaV2.1(Δ47) and Y1384C (Δ47) channels. c Average current density–voltage relationships for cells expressing CaV2.1(+ 47) and Y1384C (+ 47) channels. d Average peak current density recorded from cells expressing CaV2.1 (Δ47), Y1384C (Δ47), CaV2.1 (+ 47) and Y1384C (+ 47) channels. e Left: Representative blot of CaV2.1 (Δ47) and Y1384C (Δ47) channels surface expression (top blot) and Na/K ATPase surface expression (bottom blot). Right: Quantification of plasma membrane CaV2.1 (Δ47) and Y1384C (Δ47) channel expression normalized by Na/K ATPase cell surface expression. Data are from 3 independent experiments. f Percentage of remaining current at the end of the 250 ms test pulse with respect to the peak current amplitude. The numbers in parentheses represent the numbers of cells recorded. Asterisks denote significance *0.05, **0.01, ***0.001 levels (One-way ANOVA, and Tukey’s multiple comparison test, with a single pooled variance test)

