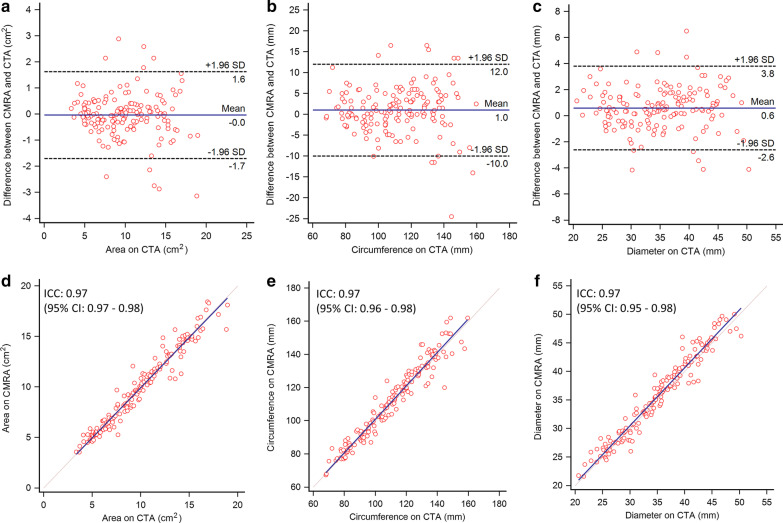
Fig. 4.
Bland–Altman and scatter plots comparing baseline CTA and CMRA measurements. Bland–Altman plots (a–c) show high agreement between CTA and CMRA for the measurements of aortic anatomic parameters. The means of differences (solid line) shown by the Bland–Altman plots are 0 cm2 (area), 1.0 mm (circumference), and 0.6 mm (diameter). Dashed lines show the 95% limits of agreement (± 1.96 standard deviation). Scatter plots (d–f) also show excellent agreement between measurements on CTA and CMRA with ICC values for area, circumference and diameter of 0.97 for each. CTA computed tomography angiography, CMRA cardiovascular magnetic resonance angiography, ICC intra-class correlation coefficient

