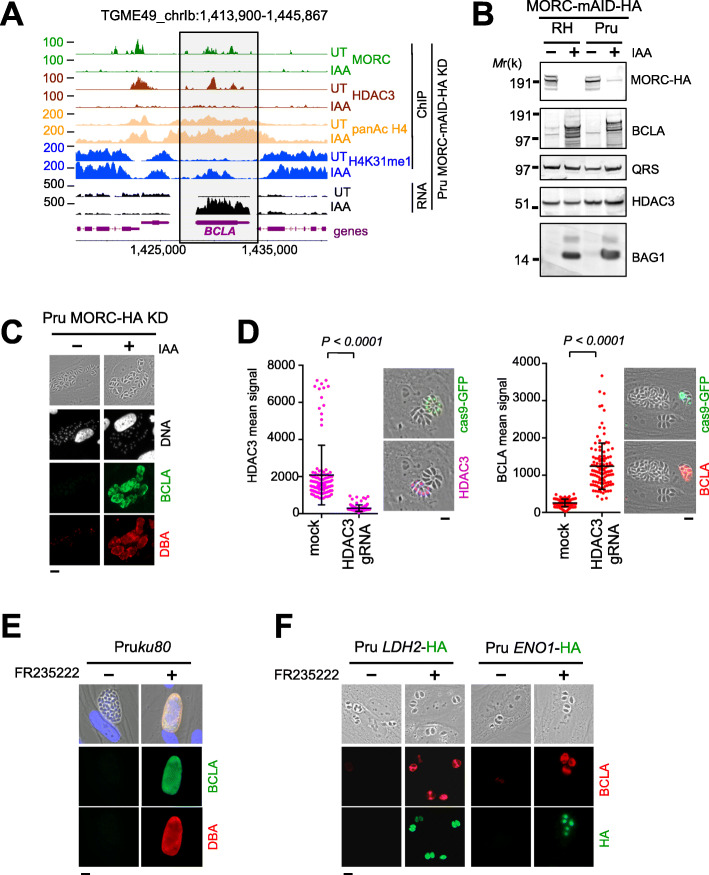
Fig. 2.
Degradation of MORC, similar to the inhibition of HDAC3, induces the expression of Bcla. a Density profiles are displayed over representative regions of Chr. Ib. Chromosomal positions are indicated on the x-axis. The ChIP-seq profiles were obtained using antibodies directed against various histone marks, HDAC3 and HA (MORC detection), and chromatin sampled from a Pru MORC KD strain that was either untreated (UT) or treated with IAA for 24 h. Read density from ChIP-seq data and RPKM values for RNA-seq data (in black) are shown on the y-axis. The Bcla gene is shown in purple. b Expression of BCLA protein upon MORC depletion in both type I (RHku80) and type II (Pruku80) intracellular tachyzoites. Samples were taken 24 h after addition the of IAA and were probed with antibodies against HA (MORC detection), BCLA (rabbit sera against BCLA peptides 1 and 2), BAG1, and HDAC3. QRS was used to control parasite loading. The experiment was repeated three times, and a representative blot is shown. c Expression levels of cyst-specific markers after depletion of MORC in the Pru strain were measured by IFA. Fixed and permeabilized parasites were probed with antibodies against BCLA (green) along with DBA lectin (red). Scale bar, 10 μm. d CRISPR-mediated genetic inactivation of hdac3 promotes a severe reduction of HDAC3 (purple) and a concomitant induction of BCLA (red). The efficiency of genetic disruption in Cas9-expressing parasites was monitored by cas9-GFP expression (in green). Graph on the left: in situ quantification of nuclear HDAC3 or vacuolar BCLA using IFA. The horizontal bars represent the mean ± s.d. of the nuclear MORC intensity from three independent experiments. The P values were calculated using one-way ANOVA. Scale bar, 5 μm. e Expression of BCLA was monitored following HDAC3 chemical inactivation by FR235222 and BCLA (green, rabbit sera against BCLA peptides 1 and 2)/DBA (red) co-staining. Scale bar, 10 μm. f Pru strains were engineered to endogenously epitope tag with HA two bradyzoite-specific markers, LDH2 and ENO1. Expression was monitored following HDAC3 chemical inactivation by FR235222 and BCLA (red, rabbit sera against BCLA peptides 1 and 2)/HA (green) co-staining. Scale bars, 10 μm. Experiments were conducted five times, and representative images are displayed

