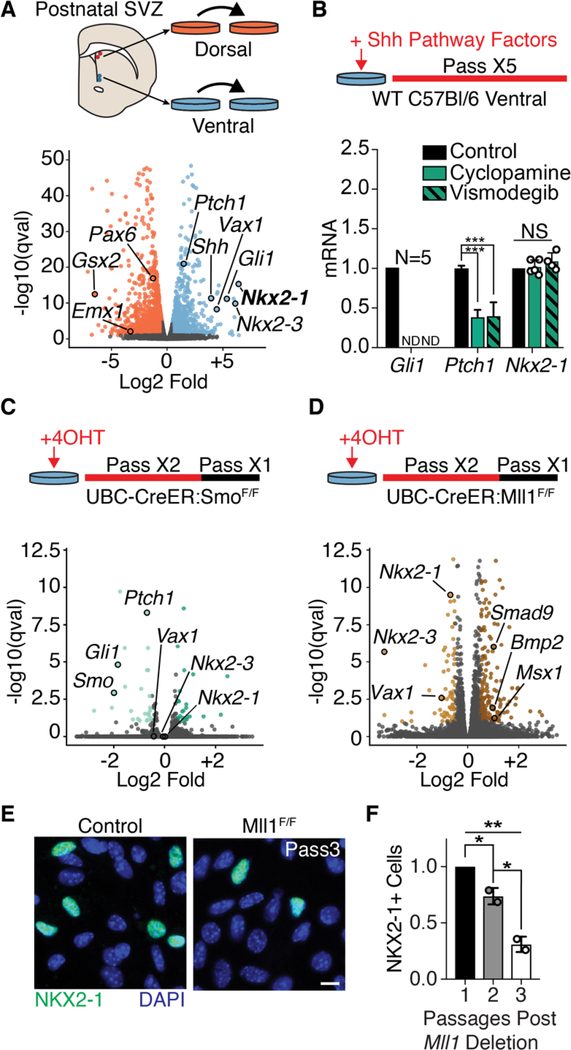
Fig. 2. Mll1-dependent NSC transcriptional identity does not require SHH signaling.
(A) Derivation of region-specific NSC cultures from the dorsal and ventral P7 mouse V-SVZ (top panel). Volcano plot of differential gene expression by RNA-seq in dorsal and ventral NSC cultures. Dorsal enriched genes, orange; ventral-enriched genes, light blue. (B) Pharmacological SHH pathway inhibition assay timeline (top panel). qPCR from ventral V-SVZ NSC cultures exposed to SHH pathway inhibitors (mean ± SD, ***P < 0.001, two-tailed student’s t test; ND, not detected). Gli1 and Nkx2–1 analysis from 4 to 5 biological replicates, Ptch1 in technical triplicate. (C) Schematic of ubiquitous Smo deletion from ventral NSC cultures by 4-OHT administration (top). Volcano plot of differential gene expression by RNA-seq in ventral UBC-CreER; SmoF/+ and UBC-CreER; SmoF/F NSC cultures. Genes up-regulated, dark green; down-regulated, light green; not significantly changed, gray. (D) Schematic of ubiquitous Mll1 deletion from ventral NSC cultures by 4-OHT administration (top). Volcano plot of differential gene expression by RNA-seq in ventral UBC-CreER;Mll1F/+ and UBC-CreER; Mll1F/F NSC cultures. Genes up-regulated, dark brown; down-regulated, light brown; not significantly changed, gray. (E) Representative image of NKX2–1+ cells in ventral UBC-CreER;Mll1F/+ and UBC-CreER;Mll1F/F NSC cultures. Scale bar, 10 mm. (F) Quantification of NKX2–1+ cells after in vitro deletion of Mll1 by UBC-CreER relative to baseline at first passage (mean ± SD, *P < 0.05, **P < 0.01, one-way analysis of variance with Tukey’s multiple comparison test).

