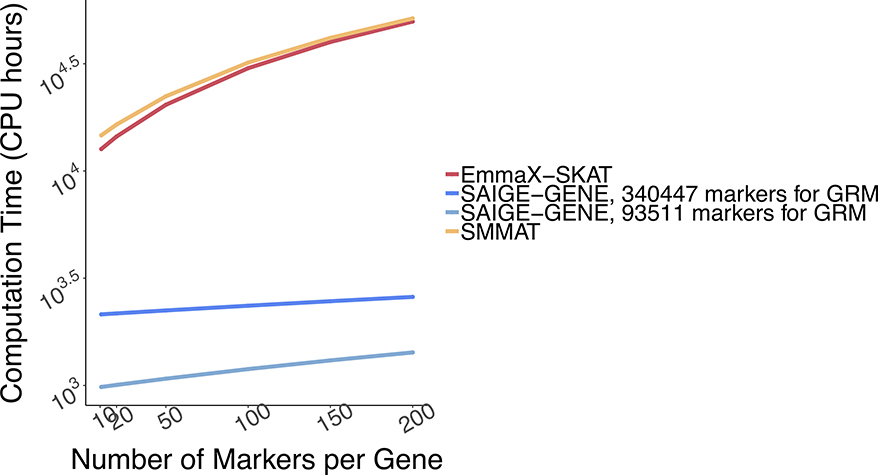
Extended Data Fig. 8. Log-log plot of the estimated run time as a function of number of markers per gene.
Benchmarking was performed on randomly sub-sampled 400,000 UK Biobank data with 408,144 white British participants for waist-to-hip ratio on 15,342 genes. The plotted run time was median of five runs with samples randomly selected from the full sample set using different sampling seeds. The computation time for other different number of markers per gene was projected based on the benchmarked time.

