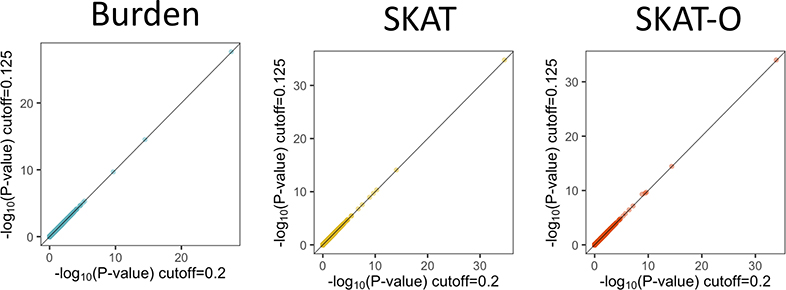
Extended Data Fig. 5. Scatter plots of association P-values on the −log10 scale from SAIGE-GENE with two sample relatedness cutoffs for the sparse GRM, 0.125 and 0.2. 15,338 genes were tested for automated read pulse rate in white British samples in the HRC-imputed UK Biobank (N = 385,365).
N, sample size. Missense and stop-gain variants with MAF ≤ 1% were included. a, Burden. b, SKAT. c, SKAT-O.

