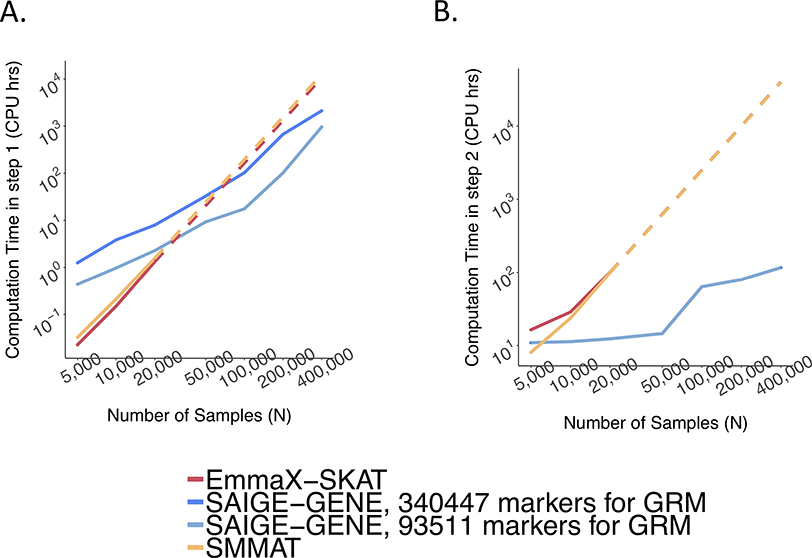
Extended Data Fig. 7. Empirical computation time.
a,b, Step 1 for fitting a null mixed model (a) and Step 2 for association tests (b), respectively, by sample sizes (N) for gene-based tests for 15,342 genes, each containing 50 rare variants. Benchmarking was performed on randomly sub-sampled UK Biobank data with 408,144 White British participants for waist-to-hip ratio. The reported run time was median of five runs with samples randomly selected from the full sample set using different sampling seeds. The reported computation time for EmmaX-SKAT and SMMAT was projected when N > 20,000. As the number of tested markers varies by sample sizes, the computation time was projected for 50 markers per gene for plotting. Numerical data are provided in Supplementary Table 1.

