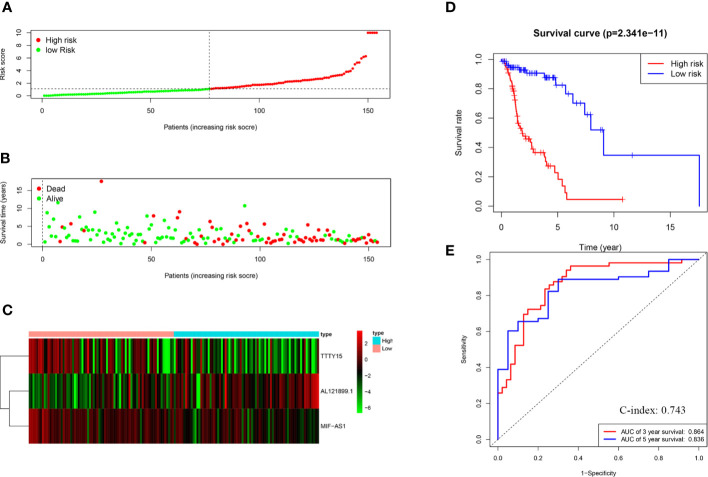
Figure 2.
Construction and evaluation of the risk score model. (A) Survival rate was significantly associated with risk score. (B) Scatterplot of patient survival. (C) Expression heatmap of three autophagy-related lncRNAs. (D) Kaplan-Meier survival curves of the high-risk group and the low-risk group. (E) ROC curve based on the risk score model. AUC: 0.5 means without any predictive power; AUC: 0.5–0.7 represents low accuracy; AUC: 0.7–0.9 means medium accuracy; AUC > 0.9 represents high accuracy.

