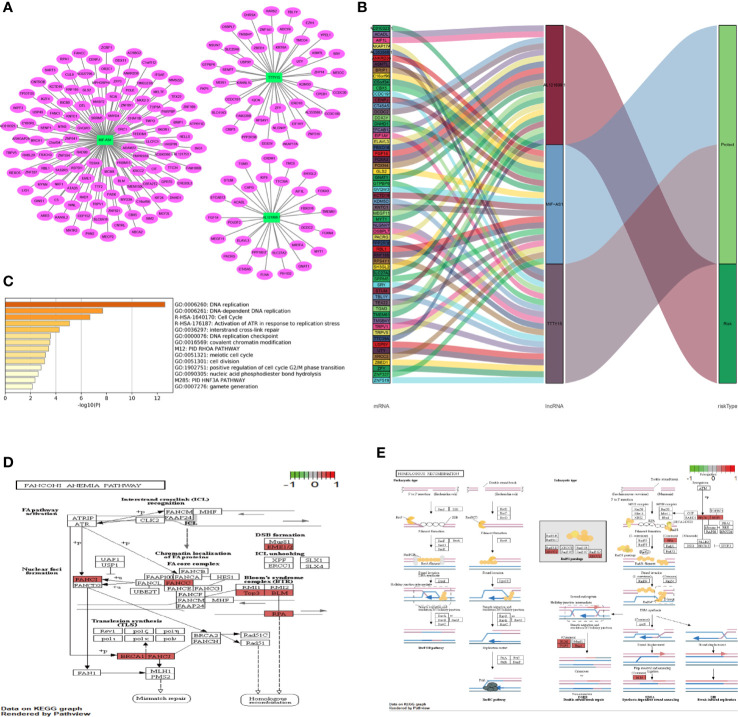
Figure 5.
Co-expression network and function enrichment analysis. (A) Construction of a co-expression network between three prognosis-related autophagy lncRNAs and PCGs. The green rectangles represent three prognosis-related lncRNAs, and the red ovals represent PCGs. (B) Sankey plots were generated to visualize association networks between the three lncRNAs, PCGs, and risk status. Due to the size of the image, the module on the left only shows the first 20 PCGs of each lncRNA. (C) Gene enrichment analysis of 189 PCGs. (D, E) KEGG pathway analysis of 189 PCGs. The red highlighted part represents the PCGs in the current study. (D) Eight PCGs involved in the Fanconi anemia pathway. (E) Seven PCGs associated with homologous recombination. PCG, protein coding gene; lncRNA, long non-coding RNA.

