. 2020 Dec 16;143(4):041007. doi: 10.1115/1.4049158

Fig. 8.

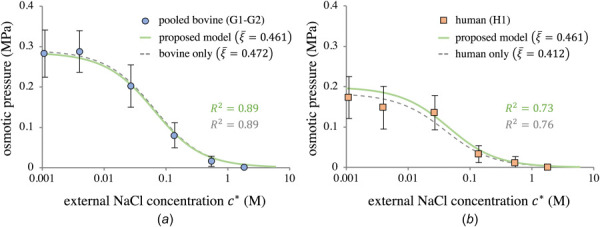
Using the proposed nonideal Donnan theory of Sec. 2.1.2 to model the osmotic pressure for (a) pooled bovine groups G1–G2 and (b) human group H1. Dashed lines represent the species-specific model predictions. Solid lines show the model predictions using the combined value ξ¯=0.461. All model curves use the average c0F for that group.

Using the proposed nonideal Donnan theory of Sec. 2.1.2 to model the osmotic pressure for (a) pooled bovine groups G1–G2 and (b) human group H1. Dashed lines represent the species-specific model predictions. Solid lines show the model predictions using the combined value ξ¯=0.461. All model curves use the average c0F for that group.